18
between 1996 and 2000 (Chart 4). Total economy productivity growth exhibited an
almost identical pattern.
Chart 4: Business Sector Output per Hour Growth in Canada and the
United States (average annual rates and annual rates of change, per cent)
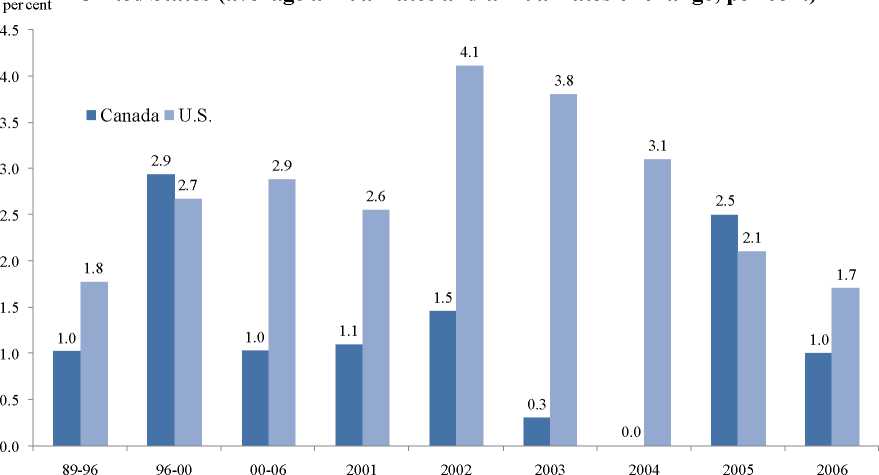
Sources : GDP in chained dollars and total hours worked from the Productivity and Costs Program of the Bureau of Labor Statist ics for the
United States, and annual averages of quarterly estimates from the Productivity Program Database of Statistics Canada for Canada.
Note: Canada's 2006 estimate is for the first three quarters only.
Canada’s productivity growth has also been very weak relative to that experienced in
the United States. Since 2000 our business sector output per hour growth rate has been
only one third the annual rate of increase of 2.9 per cent recorded south of the border
(Chart 4). Based on Industry Canada benchmark labour productivity level estimates (Rao,
Tang and Wang, 2004), Canada’s lagging labour productivity growth has resulted in the
widening of the business sector labour productivity gap from 17 percentage points in
2000 (83 per cent the US level) to 26 points in 2006 (74 per cent the US level) (Chart
5).12
From an OECD perspective, Canada’s relative productivity performance has been
very weak. Over the 1973-2006 period, output per hour in Canada advanced at only a 1.2
per cent average annual rate (Chart 6), down from 3.0 per cent in the 1950-73 period, a
drop of nearly two thirds. Since 1973 Canada has had the third lowest rate of growth in
output per hour among 23 OECD countries, with only New Zealand and Switzerland
doing worse (Summary Table 3 and Chart 7). This resulted in Canada’s level of output
per hour falling from third highest in the OECD in 1950 and in 1973 to 16th in 2006
(Chart 8).
12 The Canada-US labour productivity gap at the total economy level is less than at the business sector level
(Baldwin et al., 2005). On the issue of Canada-US productivity level and hours worked comparisons, also
see Maynard (2006) and Isgut, Bialas and Milway (2006).
More intriguing information
1. The name is absent2. he Effect of Phosphorylation on the Electron Capture Dissociation of Peptide Ions
3. The Shepherd Sinfonia
4. Expectations, money, and the forecasting of inflation
5. Non Linear Contracting and Endogenous Buyer Power between Manufacturers and Retailers: Empirical Evidence on Food Retailing in France
6. Industrial Employment Growth in Spanish Regions - the Role Played by Size, Innovation, and Spatial Aspects
7. EFFICIENCY LOSS AND TRADABLE PERMITS
8. The name is absent
9. Graphical Data Representation in Bankruptcy Analysis
10. Tax systems and tax reforms in Europe: Rationale and open issue for more radical reforms