% Change of Welfare from Base
-6 -5
-4 -3
NF(10%)
P Pw3
PEST(200%)
O
A ENG(200%)
■ OUTP(50%)
O PEST(50%)
0pest(100%)eNG(50%)
NF(50%) ,,'Pw1
A ENG(100%) '.OUTP(10%)
♦ NF(100%) .∙-'^
× Pw2
Ifl OUTP(25%)
0
-2
-4
-6
-8
-10
-12
-14
-16
INF (*) - N-fertilizer Tax , PEST(*) - pesticide tax, ENG (*) - energy tax, OUTP(*) - output tax∣
Figure 1 Egypt: Welfare and Irrigation Water Demand Changes
-0.3
NF-
PEST- PEST- PEST-
OUTP- OUTP- OUTP-
ENG- ENG- ENG-
50% 100% 200%
50% 100% 200%
10% 50% 100%
10% 25% 50%
NF- NF-
Pw2 Pw3
0.0
-0.1
-0.1
-0.2
-0.2
-0.3
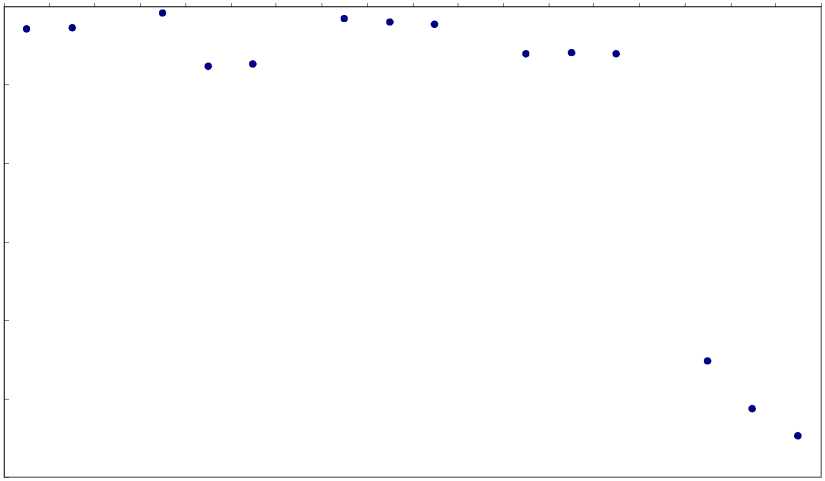
Figure 2 Egypt: Comparisons on Water Demand Elasticity
35
More intriguing information
1. PEER-REVIEWED FINAL EDITED VERSION OF ARTICLE PRIOR TO PUBLICATION2. The value-added of primary schools: what is it really measuring?
3. The name is absent
4. The name is absent
5. The name is absent
6. Wounds and reinscriptions: schools, sexualities and performative subjects
7. The Role of Immigration in Sustaining the Social Security System: A Political Economy Approach
8. Keystone sector methodology:network analysis comparative study
9. The name is absent
10. The mental map of Dutch entrepreneurs. Changes in the subjective rating of locations in the Netherlands, 1983-1993-2003