3
Generated Revenue (Billion LE)
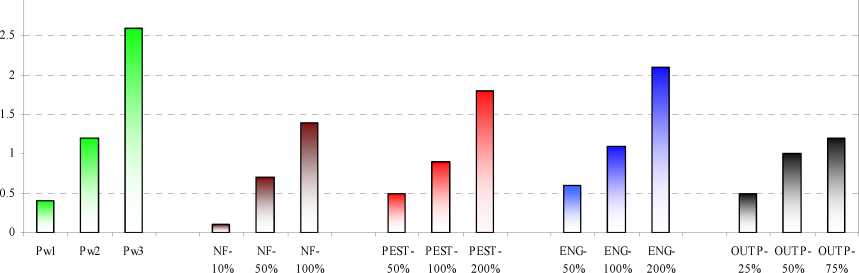
Figure 3 Egypt: Generated Revenue from each Policy Scenario (Billion LE)
Percentage Change of Welfare From Base Level
0 0.05 0.1 0.15 0.2 0.25 0.3 0.35 0.4

0
-2
-4
-6
-8
-10
-12
-14
-16

Water Pricing
• OUTP-2%
φ> ENG-50%
• OUTP-5% ♦ ENG-100%
'' ENG-200%
• OUTP-10%
Figure 4 Morocco: Welfare and Irrigation Water Demand Changes (%)
36
More intriguing information
1. Altruism with Social Roots: An Emerging Literature2. The name is absent
3. The name is absent
4. Large-N and Large-T Properties of Panel Data Estimators and the Hausman Test
5. TWENTY-FIVE YEARS OF RESEARCH ON WOMEN FARMERS IN AFRICA: LESSONS AND IMPLICATIONS FOR AGRICULTURAL RESEARCH INSTITUTIONS; WITH AN ANNOTATED BIBLIOGRAPHY
6. The storage and use of newborn babies’ blood spot cards: a public consultation
7. Discourse Patterns in First Language Use at Hcme and Second Language Learning at School: an Ethnographic Approach
8. Eigentumsrechtliche Dezentralisierung und institutioneller Wettbewerb
9. Prizes and Patents: Using Market Signals to Provide Incentives for Innovations
10. Fighting windmills? EU industrial interests and global climate negotiations