All employed persons
24
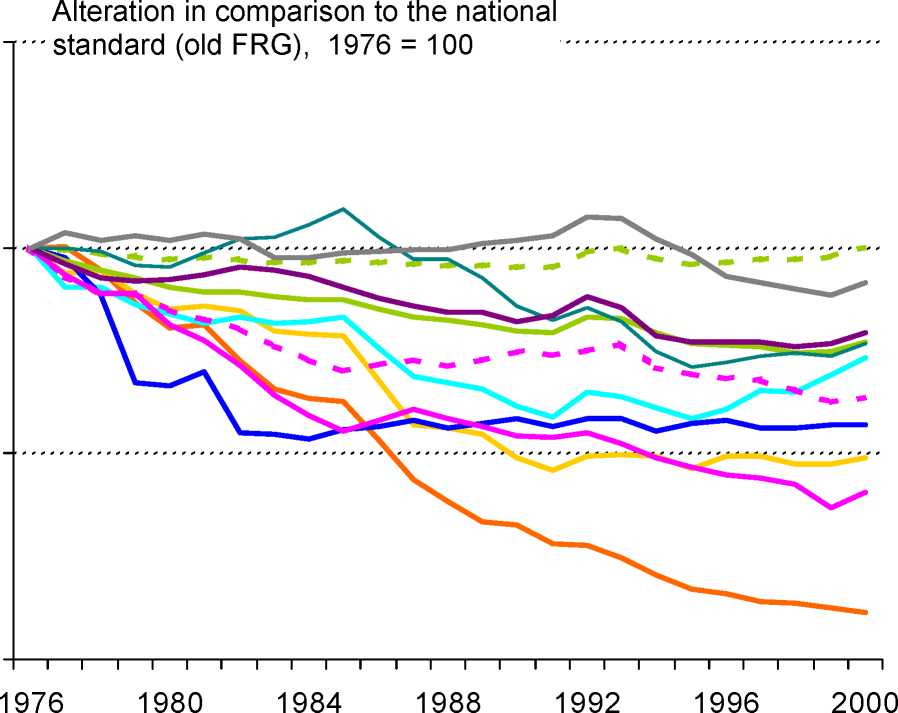
Agglomerations (0,1%)
Nürnberg (-3,4%)
Mannheim (-8,3%)
Aggl.Centres(-9,1%)
Stuttgart (-9,3%)
Koln (-10,7%)
DO-HAM-UN (-14,5%)
Bochum (-17,2%)
Essen (-20,5%)
Dortmund (-23,8%)
Duisburg (-35,4%)
Figure 8 The development of employed persons in the city of Dortmund in comparison to selected cities 1976-2000 -
alteration in comparison to the national standard (old FRG) 1976 = 100
Source: Bade et al. 2002, 12
24
More intriguing information
1. Input-Output Analysis, Linear Programming and Modified Multipliers2. Estimating the Technology of Cognitive and Noncognitive Skill Formation
3. CONSUMER PERCEPTION ON ALTERNATIVE POULTRY
4. Food Prices and Overweight Patterns in Italy
5. Ein pragmatisierter Kalkul des naturlichen Schlieβens nebst Metatheorie
6. Income Taxation when Markets are Incomplete
7. Gender and aquaculture: sharing the benefits equitably
8. Happiness in Eastern Europe
9. Conflict and Uncertainty: A Dynamic Approach
10. The name is absent