Figure 4 Mortality rates for firms in Gelderland by birth cohort, 1986-2000
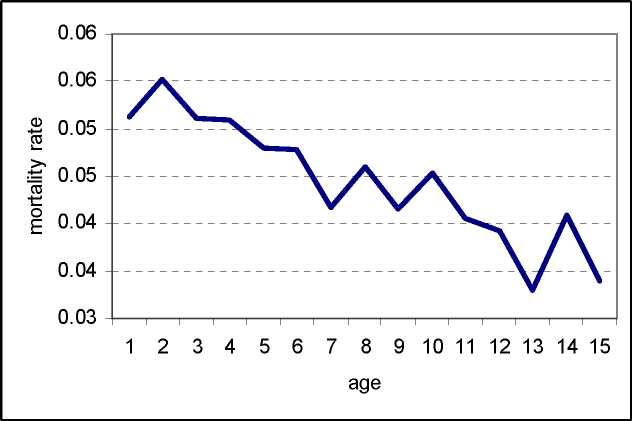
Figure 5 Mortality rates for firms in Gelderland by age
Mortality rates not only differ in each of the three time dimensions, but in the literarure
it is also known that mortality may also differ by firm size, economic activity, and
region. Each of these dimensions is included in our analysis as well. For economic
activity we divided our data into four main groups: industry, trade, services, and other
activities. See the Appendix for the way SBI codes were grouped. As shown in figure 6,
firms performing activities in the trade sector show high mortality rates, firms in the
industry sector the lowest.
As a spatial component we included the Economic Main Stucture in our analysis. For
each firm we know whether it is located in the EMS or not. Apparantly firm dynamics
are higher in the EMS, since mortality rates are lower outside the EMS than inside
(figure 6).
And last but not least firm size (number of employees). Since differences in mortality
are the largest between the lowest numbers of employees, we divided our firms once
more into firms with zero employees (the owner is the only one working), firms with
12
More intriguing information
1. Disturbing the fiscal theory of the price level: Can it fit the eu-15?2. The name is absent
3. Modelling the health related benefits of environmental policies - a CGE analysis for the eu countries with gem-e3
4. SOME ISSUES CONCERNING SPECIFICATION AND INTERPRETATION OF OUTDOOR RECREATION DEMAND MODELS
5. Concerns for Equity and the Optimal Co-Payments for Publicly Provided Health Care
6. The name is absent
7. Pupils’ attitudes towards art teaching in primary school: an evaluation tool
8. The name is absent
9. STIMULATING COOPERATION AMONG FARMERS IN A POST-SOCIALIST ECONOMY: LESSONS FROM A PUBLIC-PRIVATE MARKETING PARTNERSHIP IN POLAND
10. Place of Work and Place of Residence: Informal Hiring Networks and Labor Market Outcomes