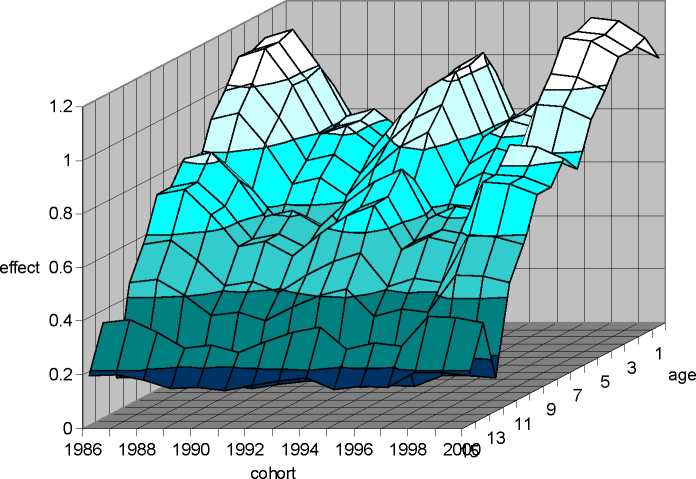
Figure 11 Combined parameter estimates for cohort and age in model 9
□ 1-1.2
□ 0.8-1
□ 0.6-0.8
□ 0.4-0.6
□ 0.2-0.4
□ 0-0.2
effect
0
2000
1997
1994 year
1991
7
9
11
13
1
age
3 5
11988
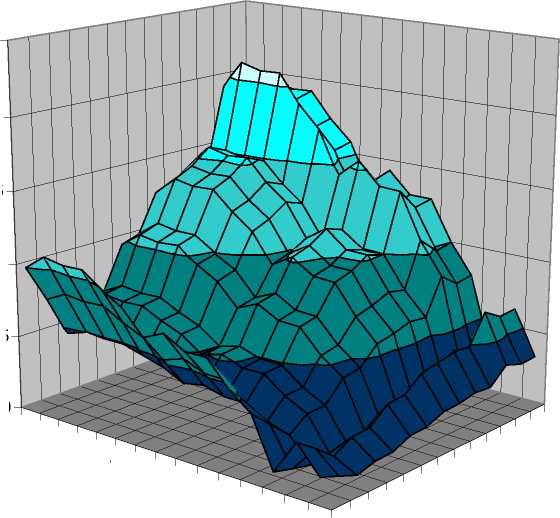
2.5
2
1.5
1
0.5
□ 2-2.5
□ 1.5-2
□ 1-1.5
□ 0.5-1
□ 0-0.5
Figure 12 Combined parameter estimates for age and period (year) in model 9
18
More intriguing information
1. The Triangular Relationship between the Commission, NRAs and National Courts Revisited2. AN ANALYTICAL METHOD TO CALCULATE THE ERGODIC AND DIFFERENCE MATRICES OF THE DISCOUNTED MARKOV DECISION PROCESSES
3. Olfactory Neuroblastoma: Diagnostic Difficulty
4. Determinants of Household Health Expenditure: Case of Urban Orissa
5. The name is absent
6. The name is absent
7. Existentialism: a Philosophy of Hope or Despair?
8. Partner Selection Criteria in Strategic Alliances When to Ally with Weak Partners
9. Literary criticism as such can perhaps be called the art of rereading.
10. Micro-strategies of Contextualization Cross-national Transfer of Socially Responsible Investment