16
with Verdoorn’s law. The trend surfaces start in three years (1996, 1997, partly 1999)
with a north-south stripe of high values along the western border. In other three years
(1993, 1998, 2000) the trend is emanating inward from mounds in the north-west and
south-east of the country.
Figure 6.1: Verdoorn’s law: scatterplots with regression lines
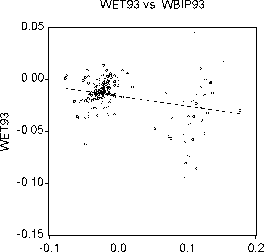
WBIP93

WBIP94
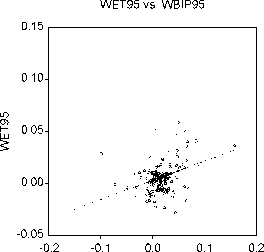
WBIP95
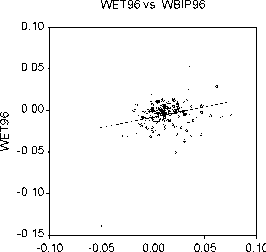
WBIP96
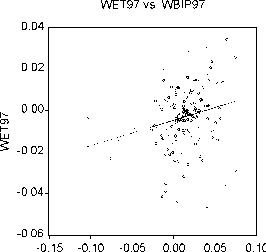
WBIP97
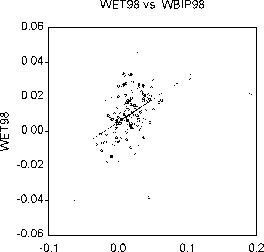
WBIP98
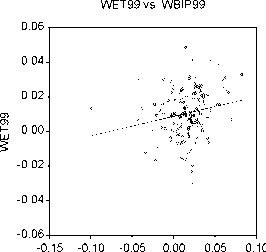
WBIP99
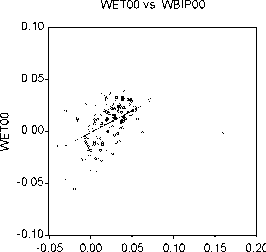
WBIP00
More intriguing information
1. Sex-gender-sexuality: how sex, gender, and sexuality constellations are constituted in secondary schools2. AN ANALYTICAL METHOD TO CALCULATE THE ERGODIC AND DIFFERENCE MATRICES OF THE DISCOUNTED MARKOV DECISION PROCESSES
3. Gerontocracy in Motion? – European Cross-Country Evidence on the Labor Market Consequences of Population Ageing
4. THE CO-EVOLUTION OF MATTER AND CONSCIOUSNESS1
5. Achieving the MDGs – A Note
6. The name is absent
7. FISCAL CONSOLIDATION AND DECENTRALISATION: A TALE OF TWO TIERS
8. Strategic Investment and Market Integration
9. The name is absent
10. DURABLE CONSUMPTION AS A STATUS GOOD: A STUDY OF NEOCLASSICAL CASES