19
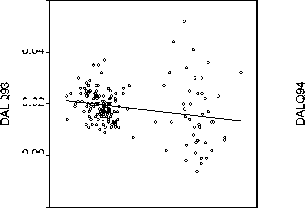
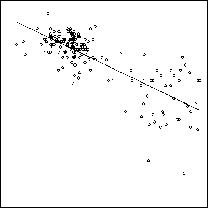
Again, the average does not reflect the variations during the sample period (Figure 6.3).
In half of the years of the sample period the Okun relation is practically suspended.
However, the spatial SUR estimate of the implied unemployment threshold of 2.2% for
the entire sample period proves to be highly significant. It is broadly in line the finding
of Schalk and Untiedt (2000) who established a decline of the unemployment threshold
by 2 percentage since the 70s. On the contrary, Walwei’s (2002) estimate lies close to
the non-spatial GLS threshold of 4.0% that seems to be overrated as spatial effects are
not controlled for.
Figure 6.3: Okun’s law: scatterplots with regression lines
DALQ93 vs. WBIP93 DALQ94 vs. WBIP94 DALQ95 vs. WBIP95
0.06
0.04.
0.02-
0.00-
0.1
0.2
-0.02
-0.1
0.02
-0.06
-0.05
0.00-
-0.04-
-0.02-
0.00 0.05 0.10
0.02

0.00-
-0.02-
-0.04-
-0.2 -0.1 0.0 0.1 0.2
0.15
WBIP93 WBIP94 WBIP95
0.0
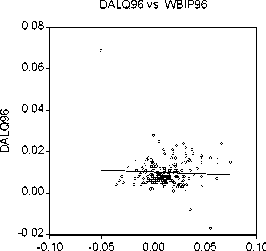
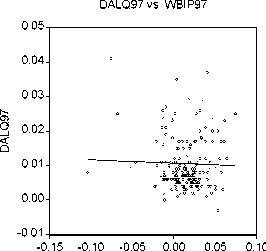
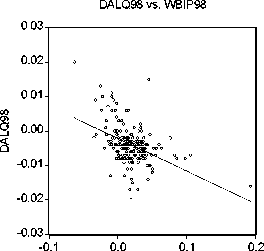
WBIP96 WBIP97 WBIP98
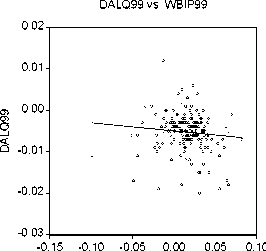
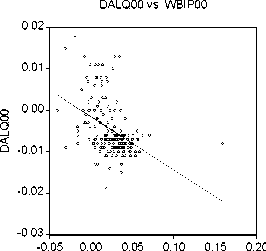
WBIP99 WBIP00
More intriguing information
1. The name is absent2. The name is absent
3. The name is absent
4. The Interest Rate-Exchange Rate Link in the Mexican Float
5. Determinants of U.S. Textile and Apparel Import Trade
6. Correlation Analysis of Financial Contagion: What One Should Know Before Running a Test
7. The name is absent
8. Unemployment in an Interdependent World
9. Healthy state, worried workers: North Carolina in the world economy
10. Reform of the EU Sugar Regime: Impacts on Sugar Production in Ireland