Average household size of the research area is 4.3, while 3.58 in izmir (SIS, 2000). Measured household
size in the research area indicates that there are widely nuclear families instead of extended families. As
shown in table 8, 66.2 % of the households are nuclear families consisting of 1-4 members. Also, 32.3 % of
the households are composed of 5-10 members. This means that these families may be partly nuclear
families with many children or partly extended families. 1, 5% of the families are extended families
including 11 and more members. Consequently, families in research population are young and nuclear
families, commonly with one or two children.
Table 8: The Household Size and Structure
|
Household Size |
Frequency |
Rates (%) |
Household Structure |
Frequency |
Rates (%) | |
|
1-4 Members |
_________43 |
________66,2 |
Nuclear family___________ |
_________49 |
________75,4 | |
|
5-10 Members |
__________21 |
________32,3 |
Extended family_________ |
____________5 |
__________7,7 | |
|
11+ Members |
___________________1 |
_______15 |
Fragmented family_______ |
___________10 |
_________15,4 | |
|
Single___________________ |
___________________1 |
_______15 | ||||
|
Total_____________ |
__________65 |
________100 |
Total____________________ |
__________65 |
________100 |
Although the migration process is not on the main axis of the study, it cannot be ignored completely,
because there is a close relation between migration, poverty and deprivation. Considering the households’
origins, just only 33, 8 percent of the research population is izmir originated, while the rest of them had
migrated from other regions (66. 2 % in different periods).
Figure 2: The Distribution of Migration Periods to izmir
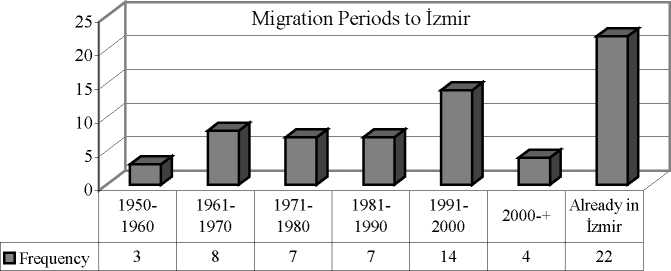
As it is known widely, migration processes in our country bases on the poverty and deprivation context.
In this scope, it is very meaningful that almost two in three of the population in Tuzcu District is migrant.
When the reasons of migrating in izmir are investigated, the proportion of unemployment and economic
reasons are very conspicuous parallel to general migration processes in our country.
Table 9: The Reasons of Migrating to izmir
|
Reasons of Migrating to Izmir |
Frequency |
Rates (%) |
|
Unemployment and Economic Reasons__________________ |
___________29 |
___________44,6 |
|
Relatives and Fellow Townsman Relations_________________ |
_____________7 |
____________10,8 |
|
Already in izmir___________________________________________ |
__________22 |
____________33,8 |
|
Vendetta_______________________________________________ |
______________________1 |
__________15 |
|
Forced Migration________________________________________ |
______________________1 |
__________15 |
|
Other Reasons__________________________________________ |
_______________5 |
_________77 |
|
Total______________________________________________________ |
____________65 |
___________100 |
In this scope, in order to understand the general characteristics of the district, it is also important to
analyze the years and the reasons of settling in Tuzcu. As mentioned earlier, the population of Tuzcu District
had decreased until 1970s, after that, it began to increase until 1975 again. The survey results show parallel
observations as this shown in table 10 above. At the same time, there is a gap between the general population
change of the district and our research findings about after the year of 1975. This gives a very critical sign
regarding to the declining process of the district. During the period of 1975-2000 whole population progress
of the district shows a decreasing structure, while the findings of the research indicates that movement to the
district has been increasing gradually at that time. In this period the declining process of the district have
14
More intriguing information
1. Three Strikes and You.re Out: Reply to Cooper and Willis2. The Veblen-Gerschenkron Effect of FDI in Mezzogiorno and East Germany
3. Word Sense Disambiguation by Web Mining for Word Co-occurrence Probabilities
4. The name is absent
5. Integrating the Structural Auction Approach and Traditional Measures of Market Power
6. THE RISE OF RURAL-TO-RURAL LABOR MARKETS IN CHINA
7. The Economics of Uncovered Interest Parity Condition for Emerging Markets: A Survey
8. The name is absent
9. The Challenge of Urban Regeneration in Deprived European Neighbourhoods - a Partnership Approach
10. Labour Market Institutions and the Personal Distribution of Income in the OECD