3.5 Interdependencies
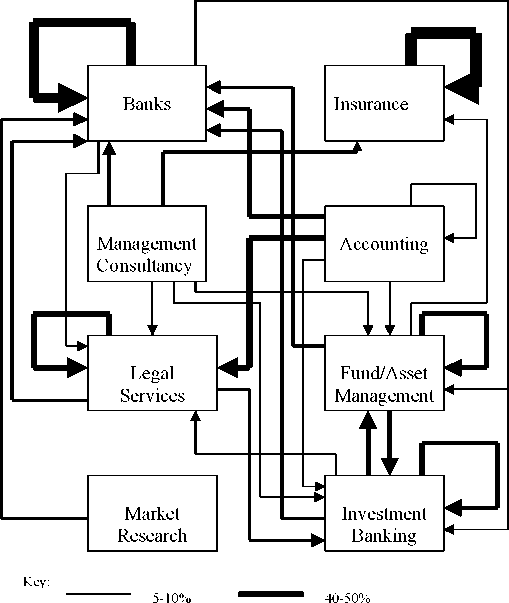
Figure 2 gives an impression of sub-sector interdependencies. The figure was
constructed by first classifying each firm to a sector on the basis of what it classed as its
most important line of activity (question 1 in the questionnaire - see Appendix 2). The
next step was to examine which sub-sectors those firms needed to have a relationship with
(question 8 in the questionnaire). 74 firms did not provide a ranking, but rather ticked three
or more boxes. These were excluded from the analysis which focused only those ranked 1.
The arrowheads show the direction of the relationship with the arrowhead entering the
sector rated as the most important to have a relationship with. The thickness of the lines
indicates the percentage of number 1 rankings for each sector as per the key provided. It is
important to bear in mind that the diagram conveys no information about the number of
rankings, for example there were only five valid rankings made by market research firms,
one of which went to banking (20%). The figure should be viewed in conjunction with
Table 9 which gives the absolute number of number 1 rankings.
Figure 2: Sub-Sector Interdependencies
-------- 11-20% 70-80%
30-39% 90-100%
More intriguing information
1. GROWTH, UNEMPLOYMENT AND THE WAGE SETTING PROCESS.2. Wirkt eine Preisregulierung nur auf den Preis?: Anmerkungen zu den Wirkungen einer Preisregulierung auf das Werbevolumen
3. The name is absent
4. The name is absent
5. Kharaj and land proprietary right in the sixteenth century: An example of law and economics
6. Passing the burden: corporate tax incidence in open economies
7. The name is absent
8. The name is absent
9. The ultimate determinants of central bank independence
10. Types of Cost in Inductive Concept Learning