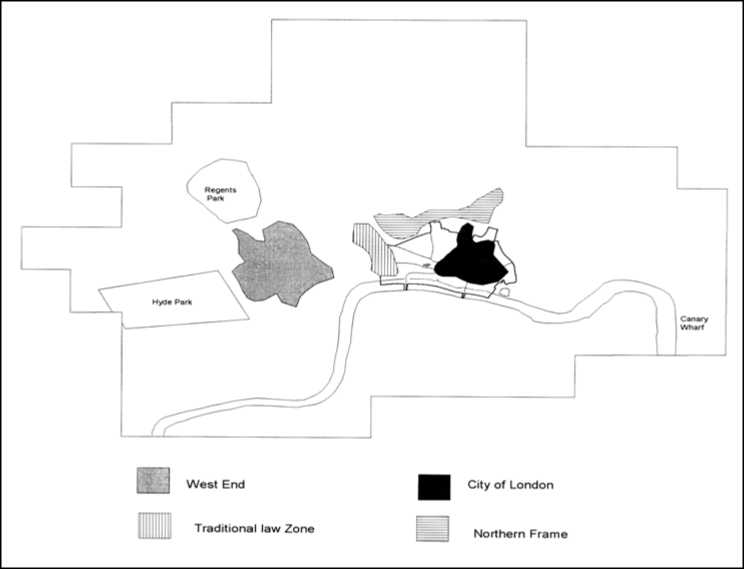
Figure 1: The London Financial Services Cluster
Data on financial services clustering in London were collected via a postal
questionnaire survey and via an in-depth face-to-face interview survey. Both survey
designs were informed by relevant theory (see Appendix 1 for an overview). For the
questionnaire survey, 1,500 questionnaires were posted. The sample was selected using a
stratified method. 100% of the largest 350 firms were selected. These were identified
primarily from a database supplied by the specialist information provider Market
Locations. The remaining 1,150 firms were drawn at random from the rest of the Market
Locations database (using a random number generator). The original mailing went out in
April 2002 with a follow-up in June 2002. A third mailing was considered but rejected in
view of the good response rate to the first two mailings. A total of 310 usable
questionnaires were returned, a response rate of just over 20%.
The postal questionnaire data are presented in Appendix 2. In almost all cases,
respondents were asked to rank the importance of a factor from 1 (not important) to 5 (very
More intriguing information
1. The name is absent2. Rent-Seeking in Noxious Weed Regulations: Evidence from US States
3. Public infrastructure capital, scale economies and returns to variety
4. Evaluating the Impact of Health Programmes
5. Reversal of Fortune: Macroeconomic Policy, International Finance, and Banking in Japan
6. Short- and long-term experience in pulmonary vein segmental ostial ablation for paroxysmal atrial fibrillation*
7. The name is absent
8. he Effect of Phosphorylation on the Electron Capture Dissociation of Peptide Ions
9. The name is absent
10. Consciousness, cognition, and the hierarchy of context: extending the global neuronal workspace model