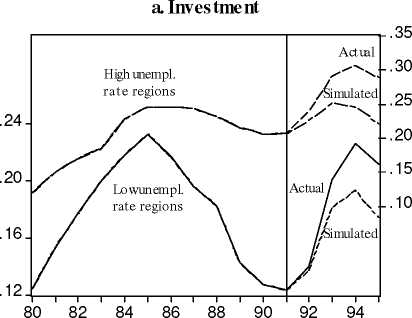
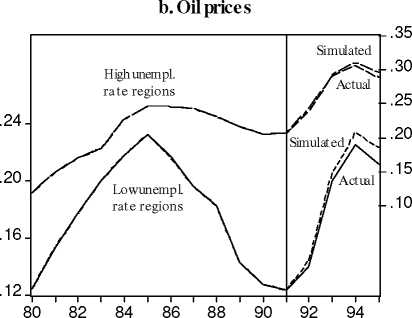
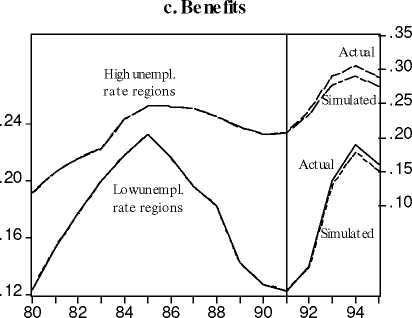
Figure 5
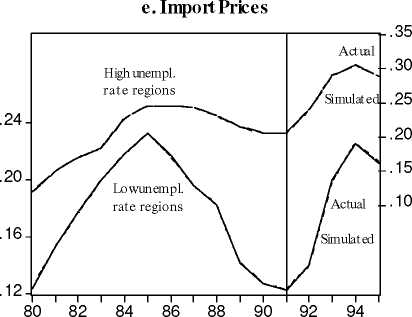
Unemployment Contributions: 1991-1995
d. Indirect Taxes
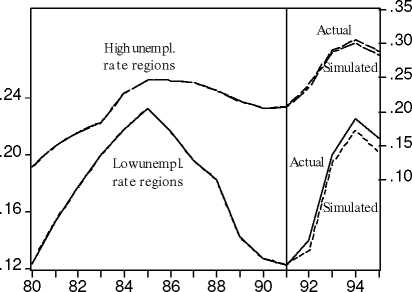
f. Working age population
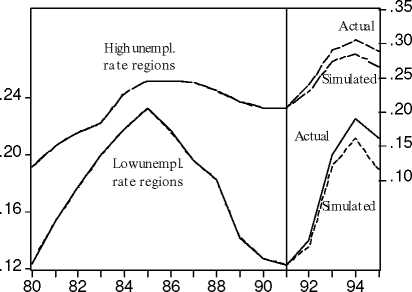
Left scale: low unemployment regions - Right scale: high unemployment regions
22
More intriguing information
1. A methodological approach in order to support decision-makers when defining Mobility and Transportation Politics2. The name is absent
3. The name is absent
4. The name is absent
5. The name is absent
6. The Values and Character Dispositions of 14-16 Year Olds in the Hodge Hill Constituency
7. Evaluation of the Development Potential of Russian Cities
8. Proceedings from the ECFIN Workshop "The budgetary implications of structural reforms" - Brussels, 2 December 2005
9. The name is absent
10. Flatliners: Ideology and Rational Learning in the Diffusion of the Flat Tax