The second variable considered in the analysis of Spanish regional growth during the period is
Productivity, measured as the Gross Added Value at constant prices by Employee. Its results
are shown in Figure 5.
Figure 5.- Rate of Industrial Productivity Growth.
1998-2002
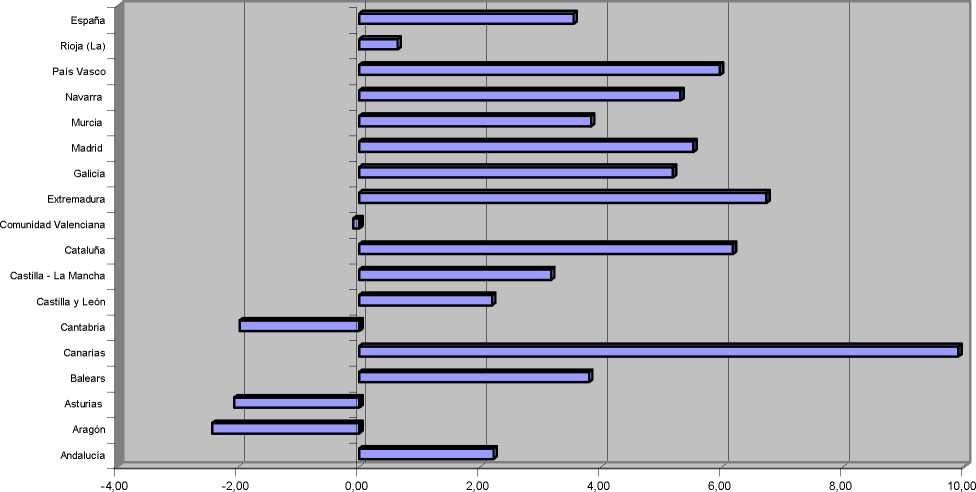
Figure 5 shows significant changes related to those obtained when we considered
Employment. Three regions experience decreases in productivity: Aragon (-2,4%); Asturias (-
2,07); and Cantabria (-1,98), meanwhile other regions reach high rates of growth, specially
Canary Islands. At the same time, Madrid and Catalonia, two regions whose evolution in
terms of employment was not very positive, increased their productivity well above national
average.
As Camagni & Capello (1999) suggest “...good productivity performance may be achieved
through different processes. It may take place through a restructuring process, when higher
productivity growth is the result of severe employment cuts; or it may be the result of a real
“virtuous cycle”, where higher than average productivity growth generates good performance
in both employment and output”. Therefore “...regional development “patterns” need to be
identified according to the trends of two indicators: employment growth (and in particular
More intriguing information
1. The name is absent2. Macro-regional evaluation of the Structural Funds using the HERMIN modelling framework
3. Economic Evaluation of Positron Emission Tomography (PET) in Non Small Cell Lung Cancer (NSCLC), CHERE Working Paper 2007/6
4. How Low Business Tax Rates Attract Multinational Headquarters: Municipality-Level Evidence from Germany
5. Testing Hypotheses in an I(2) Model with Applications to the Persistent Long Swings in the Dmk/$ Rate
6. PROJECTED COSTS FOR SELECTED LOUISIANA VEGETABLE CROPS - 1997 SEASON
7. The name is absent
8. The name is absent
9. The name is absent
10. Standards behaviours face to innovation of the entrepreneurships of Beira Interior