|
Madrid_______________________ |
_______________2,87_______________ |
________________5,52________________ |
|
Murcia________________________ |
_______________18,65_______________ |
________________3,83________________ |
|
Navarre________________________ |
_______________10,43_______________ |
________________5,31________________ |
|
Vasque Country__________________ |
________________9,14________________ |
________________5,96________________ |
|
Rioja (La)__________________________ |
_______________11,01_______________ |
________________0,63________________ |
|
Spain___________________________ |
________________7,23________________ |
________________3,54________________ |
(*) Rate of Growth measured as the value at 2002 minus the value at 1998, divided by the value at 1998.
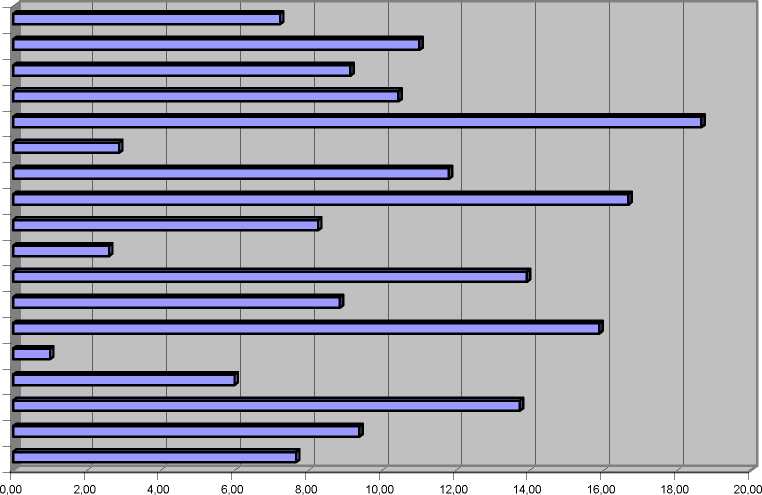
1998 to 2002 was a good period for industrial employment in Spain, increasing 7.2 points
during those 5 years. The number of people employed in the industrial sector grew in every
Spanish region, but the differences were very significant: Two very important regions, Madrid
and Catalonia, had rates which were less than half of the national mean; at the same time,
some less industrialised regions grew at very high rates: Extremadura increased its industrial
employment by 16.7%; Murcia by 18.7%; Castilla-La Mancha by 13.9%; and Asturias by
13.7%. Figure 4 graphs the results for all the Spanish regions.
Figure 4.- Rate of Industrial Employment Growth.
1998-2002
Espana
Rioja (La)
Pa^s Vasco
Navarra
Murcia
Madrid
Galicia
Extremadura
Comunidad Valenciana
Cataluna
Castilla - La Mancha
Castilla y Leon
Cantabria
Canarias
Balears
Asturias
Aragon
Andaluaa
More intriguing information
1. BARRIERS TO EFFICIENCY AND THE PRIVATIZATION OF TOWNSHIP-VILLAGE ENTERPRISES2. Housing Market in Malaga: An Application of the Hedonic Methodology
3. Should Local Public Employment Services be Merged with the Local Social Benefit Administrations?
4. Draft of paper published in:
5. The name is absent
6. The name is absent
7. Research Design, as Independent of Methods
8. CHANGING PRICES, CHANGING CIGARETTE CONSUMPTION
9. Demand Potential for Goat Meat in Southern States: Empirical Evidence from a Multi-State Goat Meat Consumer Survey
10. An Empirical Analysis of the Curvature Factor of the Term Structure of Interest Rates