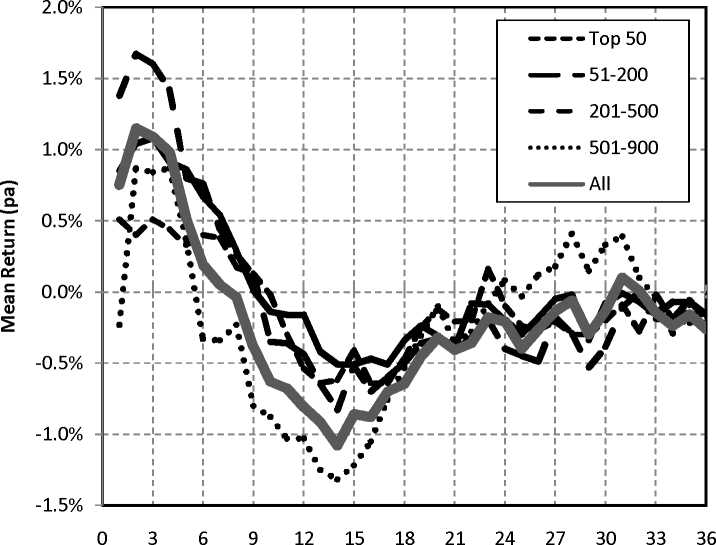
The momentum results for the period 1998 - 2004 are presented in Figure 2.
The pattern of returns is much the same with one striking exception. There
appears to be no momentum return when the analysis is limited to the top 50
stocks. This pattern is also evident in the earlier sample, but it is much
stronger in the early 2000s. It appears therefore that the results are broadly
comparable to those obtained by HP with the smaller sample. A universal
feature of the data is that across all the sub-samples considered is that
momentum appears strongest (especially in the first 6 months post portfolio
formation) in the stocks ranked between 200 and 500. This is a new result,
one which was precluded by the HP decision to limit the scope of their
empirical analysis.
Holding Period (Months)
Figure 1 Mean monthly holding period returns for up to 3 years following portfolio formation
(1973-1998).
More intriguing information
1. The name is absent2. References
3. The mental map of Dutch entrepreneurs. Changes in the subjective rating of locations in the Netherlands, 1983-1993-2003
4. Who runs the IFIs?
5. he Virtual Playground: an Educational Virtual Reality Environment for Evaluating Interactivity and Conceptual Learning
6. PEER-REVIEWED FINAL EDITED VERSION OF ARTICLE PRIOR TO PUBLICATION
7. NEW DEVELOPMENTS IN FARM PRICE AND INCOME POLICY PROGRAMS: PART I. SITUATION AND PROBLEM
8. The name is absent
9. The Values and Character Dispositions of 14-16 Year Olds in the Hodge Hill Constituency
10. Retirement and the Poverty of the Elderly in Portugal