EU and the rest of the world (extra EU trade) has increased over the years
although admittedly at a much lower pace.
Figure 1. Share of intra- and extra EUR15 - trade of goods, 1963-99.
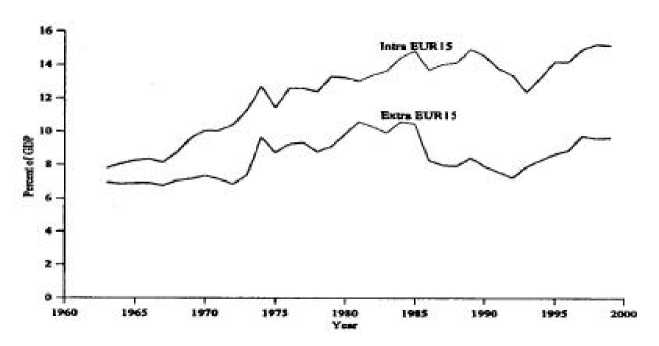
Note: Average of exports and imports in percent of GDP
Source: EU Commission (1999a). Annex: Table 38, 39, 42 and 43.
Looking closer upon how the intra EU trade shares has developed between
1963 and 1999 one finds that all countries - Denmark excluded - have
significantly increased their share. Quite according to theory the development
in the degree of openness is bigger the smaller the country size as Figure 2
seems to indicate.
Figure 2. Share of intra EUR15 - trade of goods 1963 and 1999.
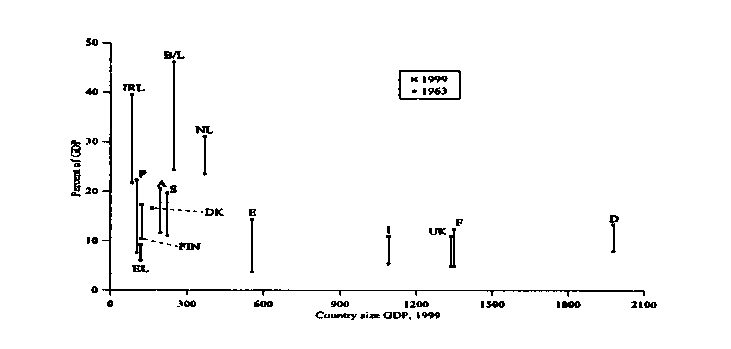
Note: Average of exports and imports in percent of GDP
Source: EU-Commission (1999a). Annex: Table 5, 38 and 42.
13
More intriguing information
1. The urban sprawl dynamics: does a neural network understand the spatial logic better than a cellular automata?2. Short report "About a rare cause of primary hyperparathyroidism"
3. The name is absent
4. QUEST II. A Multi-Country Business Cycle and Growth Model
5. Performance - Complexity Comparison of Receivers for a LTE MIMO–OFDM System
6. EXPANDING HIGHER EDUCATION IN THE U.K: FROM ‘SYSTEM SLOWDOWN’ TO ‘SYSTEM ACCELERATION’
7. The Dynamic Cost of the Draft
8. Effort and Performance in Public-Policy Contests
9. Response speeds of direct and securitized real estate to shocks in the fundamentals
10. MICROWORLDS BASED ON LINEAR EQUATION SYSTEMS: A NEW APPROACH TO COMPLEX PROBLEM SOLVING AND EXPERIMENTAL RESULTS