Figure 6. Unemployment in EUR15, Lorenz curves, 1985 and 1998
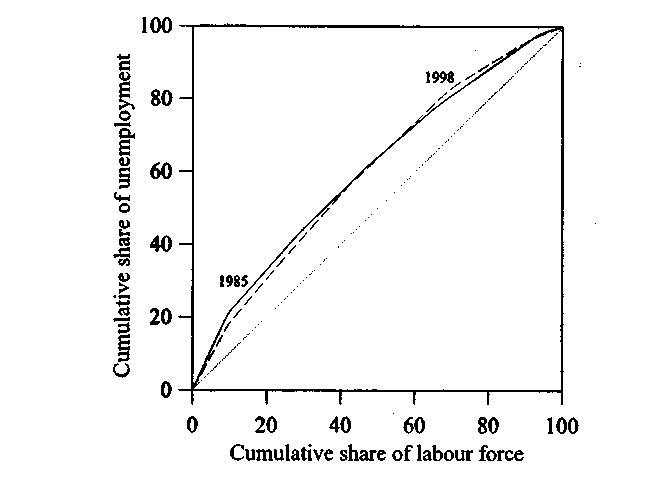
Note: The countries are ranked according to their rate of unemployment. The
Lorenz curve illustrates distribution of unemployment, i.e. the functional
relationship between the share of unemployment and the share of total
labour force in the EU, when countries are ranked according to
unemployment rate.
Source: EU Commission (1999b) pp. 127-142. Authors’ calculation.
2.3 Real convergence versus price level developments
Although there has been significant differences in growth per capita, this has
not lead to an equalization of the differences in standards of living between the
individual member countries.
Figure 7 contrasts the development in real and nominal convergence measured
in GDP per capita in PPS (purchasing power standard) with price levels of
individual member countries from the mid-1980s until the end of the 1990s. In
case of perfect integration, price levels as well as real GDP per capita will be
equal in all member countries, i.e. all economies will converge at the point
(100.1). Hence, if the EU integration were perfect, it would be expected that the
countries would move closer to the point (100.1) over time. As it appears from
the figure, generally, the relative price level increases concurrent with the
relative standard of living. This correlation between price level and standard of
21
More intriguing information
1. A model-free approach to delta hedging2. The name is absent
3. The name is absent
4. Transfer from primary school to secondary school
5. ISO 9000 -- A MARKETING TOOL FOR U.S. AGRIBUSINESS
6. Picture recognition in animals and humans
7. Nonlinear Production, Abatement, Pollution and Materials Balance Reconsidered
8. Response speeds of direct and securitized real estate to shocks in the fundamentals
9. Quelles politiques de développement durable au Mali et à Madagascar ?
10. The bank lending channel of monetary policy: identification and estimation using Portuguese micro bank data