39
Figure 1A. Distribution of net foreign asset positions, industrial countries*

□ 1975
□ 1986
□ 1997
Figure 1B. Distribution of net foreign asset positions, developing countries*
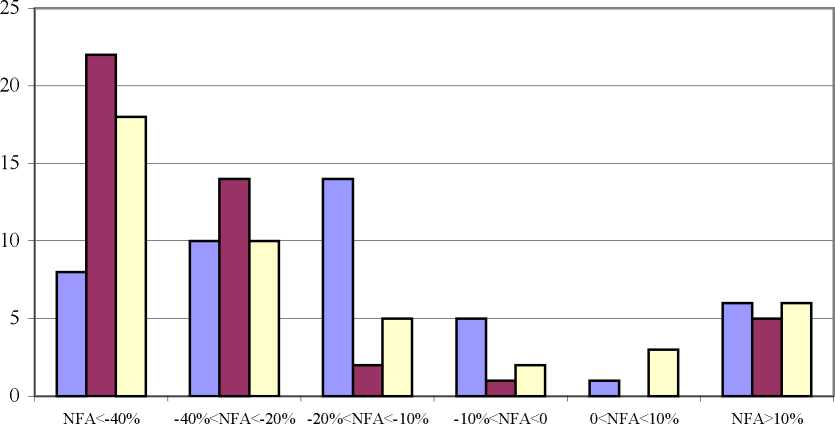
□ 1975
□ 1986
□ 1997
* Number of countries with net foreign asset position in the given range on the specific year on
the vertical axis.
More intriguing information
1. The name is absent2. AMINO ACIDS SEQUENCE ANALYSIS ON COLLAGEN
3. The name is absent
4. Real Exchange Rate Misalignment: Prelude to Crisis?
5. A Principal Components Approach to Cross-Section Dependence in Panels
6. The name is absent
7. The name is absent
8. Demographic Features, Beliefs And Socio-Psychological Impact Of Acne Vulgaris Among Its Sufferers In Two Towns In Nigeria
9. On Social and Market Sanctions in Deterring non Compliance in Pollution Standards
10. The name is absent