42
Figure 4. Net foreign assets and GDP per capita
(average change, 1990-98 over 1980-89)
A. Industrial countries
.4 -
avg change in NFA position
avg change in NFA position
ГУ ∕,fr> ∖ J
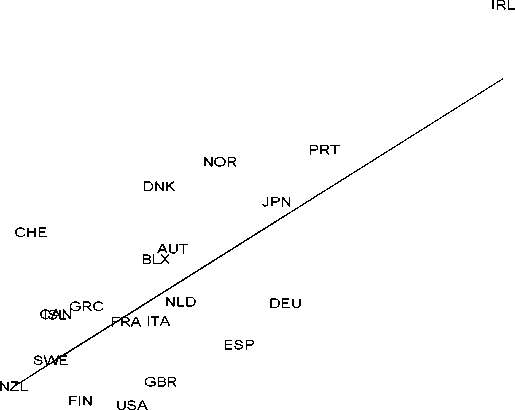
AUS
.2
.4
avg change in per capita GDP
В. Developing countries
BWA
SGP
EGY
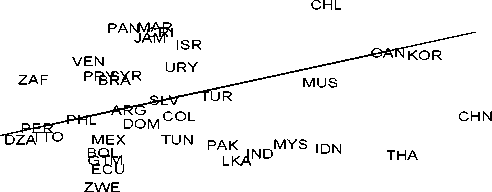
.6
CIV
-.5
.5
avg change in per capita GDP
More intriguing information
1. The growing importance of risk in financial regulation2. Workforce or Workfare?
3. Estimation of marginal abatement costs for undesirable outputs in India's power generation sector: An output distance function approach.
4. The name is absent
5. GROWTH, UNEMPLOYMENT AND THE WAGE SETTING PROCESS.
6. Behavior-Based Early Language Development on a Humanoid Robot
7. Integration, Regional Specialization and Growth Differentials in EU Acceding Countries: Evidence from Hungary
8. Gender and aquaculture: sharing the benefits equitably
9. The name is absent
10. The use of formal education in Denmark 1980-1992