43
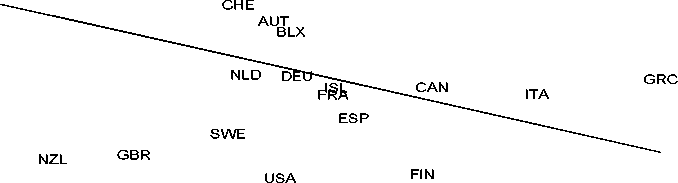
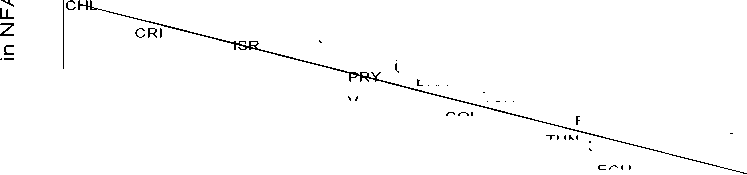
Figure 5. Net foreign assets and public debt
(average change, 1990-98 over 1980-89)
A. Industrial countries
IRL
PRT
NOR
-.2
-.2
DNK
JPN
AUS
.2
avg change in public debt
.4
.6
B. Developing Countries
BWA
SGP
.5 -
JAM
ZAF
PHL
PMANAR
KOR VOEANN
URY VEN
BRA
TUR
TUPNAK
ECU
TTO
MUS
SLV
0 -
MEX
ZWE
DZA
GTM
MYS
THA
COL
φ
σ)
⊂
(ŋ
r
O
σ)
>
(ŋ
-.5 -
I I Γ"
-.5 0 .5
avg change in public debt
More intriguing information
1. The name is absent2. The name is absent
3. Olfactory Neuroblastoma: Diagnostic Difficulty
4. The name is absent
5. The name is absent
6. Konjunkturprognostiker unter Panik: Kommentar
7. A Pure Test for the Elasticity of Yield Spreads
8. Computational Batik Motif Generation Innovation of Traditi onal Heritage by Fracta l Computation
9. Psychological Aspects of Market Crashes
10. REVITALIZING FAMILY FARM AGRICULTURE