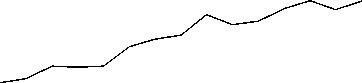
Figure 1 Standard deviation of log energy- and labour productivity at the macroeconomic level (including
aggregate Manufacturing, Transport, Services and Agriculture)
Macro
0.30 -l
S:
“ 0.25-
О
α
ω
⅛j
g, 0.20 -
a
ω

0.15 -I------------------------------------1------------------------------------1------------------------------------1------------------------------------1------------------------------------1
1970 1975 1980 1985 1990 1995
---Energy ..... Labour
Figure 2a Standard deviation of log energy productivity in main sectors
|
Manufacturing 0.9 -∣ 0.9 Ш UJ^ ст 0.6 - CT 0.6 о о Q Q W W 0.3 J--------------------.---------------------.---------------------.--------------------.--------------------1 0.3 1970 1975 1980 1985 1990 1995 Transport 0.9 -∣ 0.9 Ш UJ^ CT 0.6 - CT 0.6 O O Q —__ Q (Λ ×. (Λ 0.3 -I--------------------1---------------------1---------------------1--------------------1--------------------1 0.3 1970 1975 1980 1985 1990 1995 |
Services 970 1975 1980 1985 1990 1995 Agriculture 970 1975 1980 1985 1990 1995 |


23
More intriguing information
1. Delayed Manifestation of T ransurethral Syndrome as a Complication of T ransurethral Prostatic Resection2. The Clustering of Financial Services in London*
3. SOME ISSUES CONCERNING SPECIFICATION AND INTERPRETATION OF OUTDOOR RECREATION DEMAND MODELS
4. The name is absent
5. The name is absent
6. The name is absent
7. CONSUMER ACCEPTANCE OF GENETICALLY MODIFIED FOODS
8. Who runs the IFIs?
9. A COMPARATIVE STUDY OF ALTERNATIVE ECONOMETRIC PACKAGES: AN APPLICATION TO ITALIAN DEPOSIT INTEREST RATES
10. Discourse Patterns in First Language Use at Hcme and Second Language Learning at School: an Ethnographic Approach