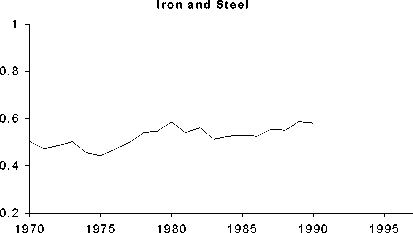
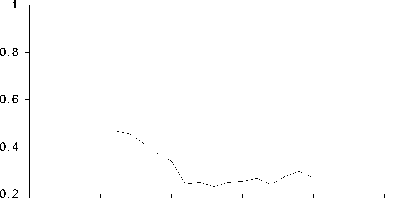
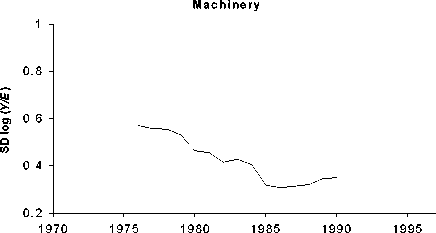
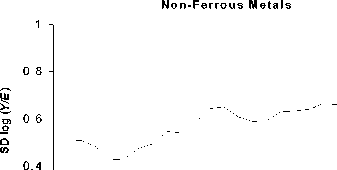
Figure 3a Standard deviation of log energy productivity in Manufacturing sectors
Chemicals
Food and Tobacco
1 -∣
SD log (Y/E ) SD log (Y/E ) SD log (Y/E ) SD log (Y/E ) SD log ( Y/E )
0.8 -
0.6 -
0.4 -

1970 1975 1980 1985 1990 1995
Transport Equipment
1 -∣
0.8 -
0.6 -

0.2 -I----------------------------1----------------------------1----------------------------1----------------------------1----------------------------1------
1970 1975 1980 1985 1990 1995
Non-Metallic Minerals
1970 1975 1980 1985 1990 1995
Textiles and Leather

1970 1975 1980 1985 1990 1995

0.2

1970 1975 1980 1985 1990 1995
1970 1975 1980 1985 1990 1995
1 -∣
0.8 -
S
σ> 0.6-
o
Q
И
0.4 -
Paper, Pulp and Printing

0.2 -I----------------------------1----------------------------1----------------------------1----------------------------1----------------------------1------
1970 1975 1980 1985 1990 1995
Wood and Wood Products

0.8 -
S
J 0.6 -
Q
И
0.4 -
0.2 -I---------------------------1---------------------------1---------------------------1----------------------------1---------------------------1------
1970 1975 1980 1985 1990 1995
25
More intriguing information
1. El Mercosur y la integración económica global2. RETAIL SALES: DO THEY MEAN REDUCED EXPENDITURES? GERMAN GROCERY EVIDENCE
3. Testing for One-Factor Models versus Stochastic Volatility Models
4. A Rational Analysis of Alternating Search and Reflection Strategies in Problem Solving
5. Cultural Neuroeconomics of Intertemporal Choice
6. Olfactory Neuroblastoma: Diagnostic Difficulty
7. Labour Market Institutions and the Personal Distribution of Income in the OECD
8. Improvement of Access to Data Sets from the Official Statistics
9. Aktive Klienten - Aktive Politik? (Wie) Läßt sich dauerhafte Unabhängigkeit von Sozialhilfe erreichen? Ein Literaturbericht
10. A Rare Case Of Fallopian Tube Cancer