124
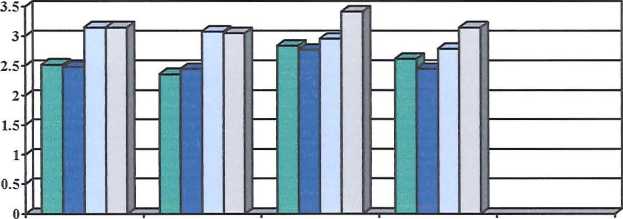
Table 4.2.2: Perceptions of pupils’ affective attitudes towards mathematics learning as
promoted by Using a computer
|
5th grade teachers |
8ft grade teachers |
5lh graders________________ |
8lh graders________________ | |||||||||
|
N____ |
Mean |
SD |
N____ |
Mean |
SD |
N____ |
Mean |
SD |
N____ |
Mean |
SD | |
|
Enjoyment________ |
47 |
3.87 |
.90 |
40 |
3.68 |
1.00 |
1476 |
3.31 |
1.56 |
2155 |
3.05 |
1.52 |
|
Motivation__________ |
48 |
3.77 |
1.04 |
40 |
3.50 |
.78 |
1476 |
3.33 |
1.50 |
2147 |
2.90 |
1.39 |
|
Sense Ofsecurity |
46 |
3.24 |
.85 |
38___ |
3.32 |
.66 |
1472 |
3.09 |
1.46 |
2138 |
2.61 |
1.28 |
|
Sense of progress |
47____ |
3.15 |
.72 |
40____ |
3.05 |
.81 |
1469 |
3.11 |
1.37 |
2138 |
2.57 |
1.22 |
|
Repeated measure ANOVA |
F(2.605,114.599)=13.001, |
F(2.011,74.404)=6.629, |
F(2.704,3950.298)=31.317, |
F(2.609, | ||||||||
|
Deployment_______ |
48____ |
1.77 |
-78 |
42 |
1 48 |
∏4 |
1473 |
1.53 |
.80 |
2144 |
1.34 |
R7 |
Reading a textbook
In contrast to Practical work and Using a computer, Reading a textbook was seen to
promote a sense of security and sense of progress (see Figure 4.2.3 and Table 4.2.3).
There was also less difference between the responses of teachers and students.
Although Reading a textbook was relatively frequently adopted in mathematics classes,
overall Reading a textbook was not viewed very positively by any of the participants.
Figure 4.2.3: Perceptions of pupils’ affective attitudes towards mathematics learning as
promoted by Reading a textbook
□ enjoyment
□ motivation
□ sense of security
□ sense of progress
I 5th grade teachers ∣ 8th grade teachers ∣ 5lh graders
I 8th graders
Table 4.2.3: Perceptions of pupils’ affective attitudes towards mathematics learning as
promoted by Reading a textbook __________ ______________________
|
5lt1 grade teachers________ |
8ltl grade teachers________ |
5lh graders________________ |
8lh graders________________ | |||||||||
|
N |
Mean |
SD |
N____ |
Mean |
SD |
N____ |
Mean |
SD |
N |
Mean |
SD | |
|
Enjoyment________ |
48 |
2.52 |
.87 |
42 |
2.36 |
.93 |
1475 |
2.84 |
1.18 |
2154 |
2.62 |
1.19 |
|
Motivation__________ |
48 |
2.48 |
.95 |
42 |
2.45 |
.94 |
1476 |
2.77 |
1.28 |
2142 |
2.45 |
1.17 |
|
Senseofsecurity |
47 |
3.15 |
.93 |
40____ |
3.08 |
1.00 |
1471 |
2.96 |
1.32 |
2141 |
2.79 |
1.24 |
|
Sense of progress |
48 |
3.15 |
.85 |
42 |
3.05 |
.94 |
1473 |
3.42 |
1.34 |
2141 |
3.15 |
1.26 |
|
Repeated |
F(2.385,109.716)=26.140, |
F(2.441, 95.183)=16.461, |
F(2.827,4136.341)=159.355 p<,01________________________ |
F(2.800,5938.988)=295.240 | ||||||||
|
Deployment_______ |
48_____ |
3.50 |
1.11 |
3.12 |
1.27 |
1473 |
rɜŋ |
-97 |
2136 |
1.15 | ||
124
More intriguing information
1. Fiscal Insurance and Debt Management in OECD Economies2. Mergers and the changing landscape of commercial banking (Part II)
3. The name is absent
4. Standards behaviours face to innovation of the entrepreneurships of Beira Interior
5. Strategic Policy Options to Improve Irrigation Water Allocation Efficiency: Analysis on Egypt and Morocco
6. Climate Policy under Sustainable Discounted Utilitarianism
7. Banking Supervision in Integrated Financial Markets: Implications for the EU
8. EU Preferential Partners in Search of New Policy Strategies for Agriculture: The Case of Citrus Sector in Trinidad and Tobago
9. Backpropagation Artificial Neural Network To Detect Hyperthermic Seizures In Rats
10. Towards a Mirror System for the Development of Socially-Mediated Skills