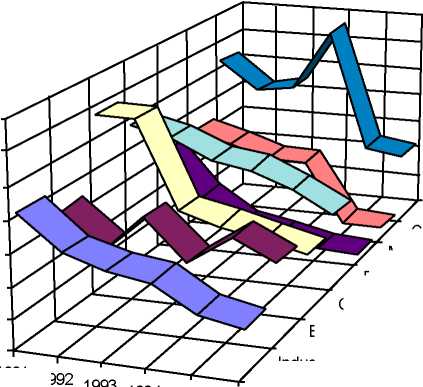
Table 10: Industrial Investment in Ukraine by Sectors
(per cent to 1990)
|
1991 |
1992 |
1993 |
1994 |
1995 |
1996 |
1997 | |
|
Industry - total |
82,2 |
60,4 |
52,5 |
48,5 |
33,2 |
27,4 | |
|
Electrical Energy |
66,3 |
45,5 |
69,6 |
43,3 |
62,9 |
50,4 | |
|
Coal Industry |
114,1 |
114,4 |
58,2 |
51,2 |
45,5 |
38,9 | |
|
Oil Industry |
84,6 |
61,4 |
146,7 |
209,8 |
82,3 |
70,7 | |
|
Gas Industry |
57,2 |
17,7 |
62,3 |
48,7 |
25,6 |
42,2 | |
|
Peat Industry |
55,6 |
33,3 |
22,2 |
22,2 |
22,2 |
11,1 | |
|
Ferrous Metallurgy |
95,5 |
87,8 |
75,6 |
72,6 |
62,7 |
48,0 | |
|
Nonferrous Metallurgy |
85,1 |
54,6 |
48,3 |
39,1 |
37,9 |
35,1 | |
|
Chemical and Petrochemical |
82,8 |
63,8 |
66,6 |
139,3 |
67,7 |
27,1 | |
|
Machine-Building and |
61,8 |
33,8 |
16,6 |
12,7 |
6,5 |
5,0 | |
|
Wood and Wood Processing |
84,7 |
38,1 |
22,5 |
21,1 |
20,6 |
14,4 | |
|
Building Materials |
109,2 |
58,8 |
33,7 |
22,9 |
12,9 |
11,0 | |
|
Glass and Clay |
113,3 |
88,3 |
30,0 |
46,7 |
26,7 |
30,0 | |
|
Consumer Goods |
63,8 |
58,0 |
48,2 |
48,8 |
8,3 |
7,4 | |
|
Food Processing_____________ |
105,2 |
84,0 |
88,1 |
131,6 |
48,4 |
44,2_________ | |
140,0
120,0
100,0
80,0
60,0
40,0
20,0
Industry - total
1991
1994
1995 1996
Food Processing
Consumer Goods
Metal Processing
Ferrous Metallurgy
Coal Industry
Electrical Energy
Chart 3. Industrial Investment in Ukraine by Sectors, per cent to 1990
Gross Domestic Product, the main indicator for economic development of the country
which describes the output of goods and services for the final consumption of the society was
estimated for Ukraine in the volume of 92.5 billion griven in 1997. In comparison with 1996 it
was reduced by 3.2 per cent i.e. 68 per cent that of the one in 1990. The value added was
10
More intriguing information
1. The name is absent2. MICROWORLDS BASED ON LINEAR EQUATION SYSTEMS: A NEW APPROACH TO COMPLEX PROBLEM SOLVING AND EXPERIMENTAL RESULTS
3. The name is absent
4. The name is absent
5. The problem of anglophone squint
6. The name is absent
7. CONSUMER PERCEPTION ON ALTERNATIVE POULTRY
8. Konjunkturprognostiker unter Panik: Kommentar
9. The urban sprawl dynamics: does a neural network understand the spatial logic better than a cellular automata?
10. The name is absent