Table 15: Durable Goods Output in Ukraine
(per cent to previous year)
|
1990 |
1991 |
1992 |
1993 |
1994 |
1995 |
1996 |
1997 | |
|
TVs |
105,0 |
95,8 |
71,0 |
74,7 |
42,8 |
38,4 |
37,5 | |
|
Radios |
135,0 |
114,8 |
91,0 |
98,2 |
37,9 |
41,4 |
37,6 | |
|
Refrigerators |
102,0 |
97,8 |
94,9 |
90,3 |
86,3 |
86,1 |
76,7 | |
|
Washing machines |
121,0 |
105,3 |
97,0 |
79,9 |
65,6 |
50,5 |
70,0 | |
|
Vacuum cleaners_____ |
119,0 |
97,3 |
83,1 |
106,0 |
44,0 |
70,4 |
40,0 |
Table 16: Durable Goods Output in Ukraine
(per cent to 1990)
|
1990 |
1991 |
1992 |
1993 |
1994 |
1995 |
1996 |
1997 | |
|
TVs |
100,0 |
95,8 |
68,1 |
50,8 |
21,8 |
8,3 |
3,1 | |
|
Radios |
100,0 |
114,8 |
104,5 |
102,6 |
38,9 |
16,1 |
6,0 | |
|
Refrigerators |
100,0 |
97,8 |
92,8 |
83,8 |
72,3 |
62,2 |
47,7 | |
|
Washing machines |
100,0 |
105,3 |
102,2 |
81,6 |
53,6 |
27,0 |
18,9 | |
|
Vacuum cleaners_____ |
100,0 |
97,3 |
80,9 |
85,7 |
37,7 |
26,6 |
10,6 |
1994
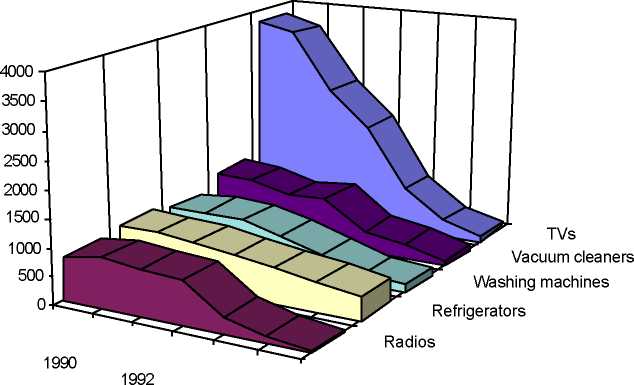
Chart 4. Durable Goods Output in Ukraine, thousands units
The reduction of output is going on in the parallel with mass filling the Ukrainian market
with imported goods similar to the domestically produced ones. The process of displacement of
home industry from the domestic market of durable goods is occurring currently under the
severe competition and the absence of state assistance to local producers. The sharp reduction of
16
More intriguing information
1. The name is absent2. Qualifying Recital: Lisa Carol Hardaway, flute
3. Creating a 2000 IES-LFS Database in Stata
4. Modelling Transport in an Interregional General Equilibrium Model with Externalities
5. The name is absent
6. Cultural Diversity and Human Rights: a propos of a minority educational reform
7. Forecasting Financial Crises and Contagion in Asia using Dynamic Factor Analysis
8. Constrained School Choice
9. The name is absent
10. Centre for Longitudinal Studies