Figure 4. Change in total firm population in Turkey, 1985-1992
The bulk of micro firms in manufacturing industry results in the same growth rate pattern
with very close rates as total firms (figure 5). Still the lowest rates are found in the Northeast
and the East, while the highest micro firm growth rates are observed in Sinop (0.28) in the
North, Icel (0.261) in the South and Usak (0.209) in the West.
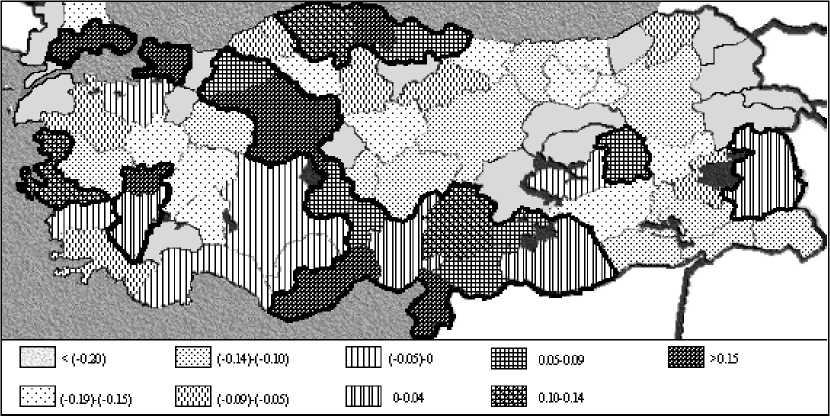
Figure 5. Change in micro firm (<10 persons) population in Turkey, 1985-1992
When the firm growth rate is calculated for non-micro firms employing more than 9 people,
a different structure appears. Although there are provinces (Tunceli and Mus in the East)
with no firm in this category, the national average is higher (0.05) than the previous two
rates. Not only in most regions of the country firm growth rate is positive in a connected
More intriguing information
1. Nonparametric cointegration analysis2. Happiness in Eastern Europe
3. Real Exchange Rate Misalignment: Prelude to Crisis?
4. Individual tradable permit market and traffic congestion: An experimental study
5. The name is absent
6. Types of Cost in Inductive Concept Learning
7. How do investors' expectations drive asset prices?
8. Education Responses to Climate Change and Quality: Two Parts of the Same Agenda?
9. The name is absent
10. The changing face of Chicago: demographic trends in the 1990s