□ 1963 ∏1970 ∏1980 □ 1985 ∏1992
Figure 1. Share of firms by size classes, 1963-1992
Due to data constraints, when the figures for 1970 and 1980 are disregarded, it can be said
that as a result of a steady increase in the share of micro firms from 0% in 1963 to 95% in
1992, that of other size classes has decreased. When the number of persons engaged has
been viewed by size classes, the rates are much more fluctuated as shown in figure 3. The
most important result from these two figures is that, the share of firms and the share of
persons engaged are not relatively distributed across the size classes.
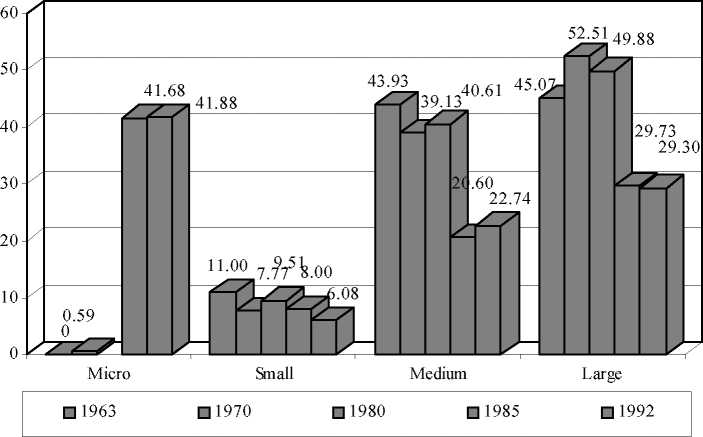
Figure 2. Share of persons engaged by size classes, 1963-1992
More intriguing information
1. Proceedings of the Fourth International Workshop on Epigenetic Robotics2. Opciones de política económica en el Perú 2011-2015
3. The name is absent
4. Better policy analysis with better data. Constructing a Social Accounting Matrix from the European System of National Accounts.
5. On s-additive robust representation of convex risk measures for unbounded financial positions in the presence of uncertainty about the market model
6. Transport system as an element of sustainable economic growth in the tourist region
7. DEVELOPING COLLABORATION IN RURAL POLICY: LESSONS FROM A STATE RURAL DEVELOPMENT COUNCIL
8. Short report "About a rare cause of primary hyperparathyroidism"
9. Credit Markets and the Propagation of Monetary Policy Shocks
10. The name is absent