From now on, we fix β = 0.9 since this parameter does not a critical role
in our analysis. Our first simulation provides a parameters region sustaining
a .85-crash, which corresponds to a drop of 15% in price of all assets traded
(assuming no dividend is paid).
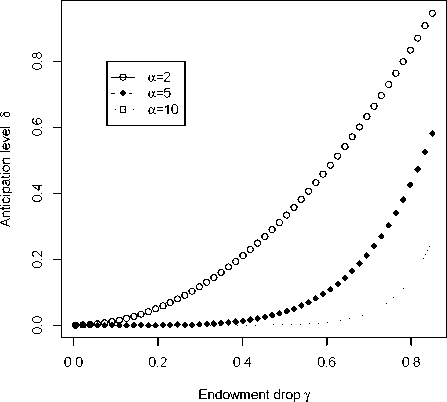
Figure 1: Parameters region sustaining a .85-crash (15% price drop)
Figure 1 simultaneously displays such regions for various level of risk-
aversion. For every curve, any point of parameters above the curve sustains
the .85-crash. For instance, for an agent with a level of risk-aversion of 5, any
20% drop in endowment next period that is anticipated with probability of at
least .5 in the current period will trigger a .85-crash next if the drop actually
occurs. Figure 1 also shows that, for those last values, any anticipation level
below .5 may not trigger the crash, as is explained in the Introduction. This
15
More intriguing information
1. Fiscal federalism and Fiscal Autonomy: Lessons for the UK from other Industrialised Countries2. Magnetic Resonance Imaging in patients with ICDs and Pacemakers
3. The name is absent
4. Empirically Analyzing the Impacts of U.S. Export Credit Programs on U.S. Agricultural Export Competitiveness
5. The quick and the dead: when reaction beats intention
6. The name is absent
7. The name is absent
8. The name is absent
9. The name is absent
10. RETAIL SALES: DO THEY MEAN REDUCED EXPENDITURES? GERMAN GROCERY EVIDENCE