16
Chart 1. Innovation rate* of the firms, meso-regions, 2000,
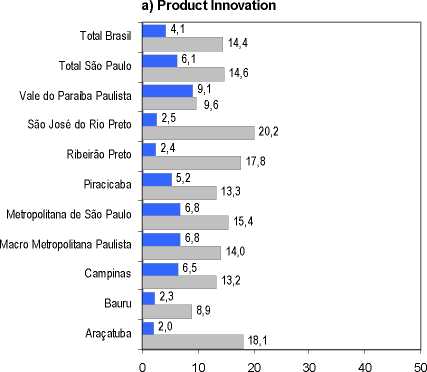
* The innovation rate consists in the number of firms
that had implemented innovation among the whole of
firms.
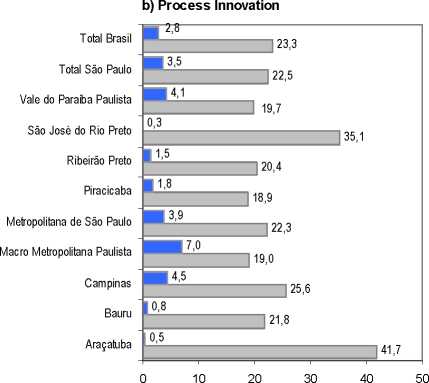
□ New for national market
□ New for firm
Source: IBGE/PINTEC, 2000. Authors own elaboration.
Table 1. Regional distribution of well-evaluated courses, by micro-region, State of Sao
Paulo, 2002._________________________________________________________________
|
Micro-region |
N° of |
Graduated Students N° % |
Share of students | |
|
Sao Paulo |
15 |
1.315 |
38,7 |
27,1 |
|
Campinas |
6 |
421 |
12,4 |
39,9 |
|
Piracicaba |
2 |
277 |
8,2 |
65,2 |
|
Sao Carlos |
6 |
229 |
6,7 |
69,4 |
|
Bauru |
3 |
158 |
4,7 |
45,7 |
|
Araraquara |
2 |
155 |
4,6 |
66,8 |
|
Botucatu |
2 |
127 |
3,7 |
100,0 |
|
Andradina |
4 |
116 |
3,4 |
100,0 |
|
Sao José dos Campos |
4 |
115 |
3,4 |
29,6 |
|
Guaratingueta |
3 |
95 |
2,8 |
37,4 |
|
Jaboticabal |
1 |
94 |
2,8 |
100,0 |
|
Rio Claro |
1 |
75 |
2,2 |
100,0 |
|
Limeira |
2 |
70 |
2,1 |
68,6 |
|
Sao José do Rio Preto |
1 |
50 |
1,5 |
19,2 |
|
Sorocaba |
1 |
31 |
0,9 |
10,2 |
|
Maiilia |
2 |
30 |
0,9 |
21,9 |
|
Santos |
1 |
21 |
0,6 |
4,0 |
|
Assis |
1 |
15 |
0,4 |
22,4 |
|
Others__________________ |
0 |
0 |
0,0 |
__________0,0__________ |
|
Total___________________ |
57___ |
3.394 |
100 |
26,5_________ |
Source: MEC/INEP. Authors own elaboration.
More intriguing information
1. Philosophical Perspectives on Trustworthiness and Open-mindedness as Professional Virtues for the Practice of Nursing: Implications for he Moral Education of Nurses2. EFFICIENCY LOSS AND TRADABLE PERMITS
3. The Dynamic Cost of the Draft
4. Dual Inflation Under the Currency Board: The Challenges of Bulgarian EU Accession
5. The name is absent
6. SME'S SUPPORT AND REGIONAL POLICY IN EU - THE NORTE-LITORAL PORTUGUESE EXPERIENCE
7. EMU's Decentralized System of Fiscal Policy
8. The name is absent
9. A model-free approach to delta hedging
10. The name is absent