18
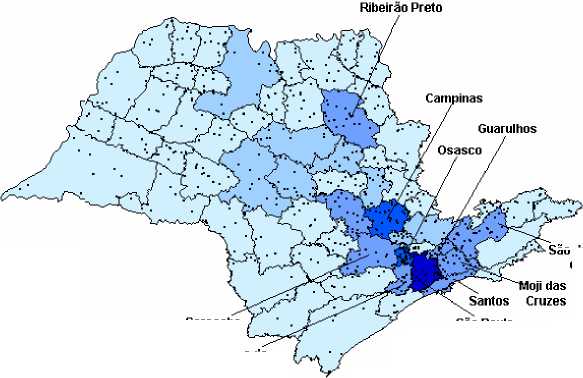
Map 1. Distribution of skilled occupations in Sao Paulo, by micro-region, State of Sao Paulo, 2002
Sao José dos
Campos
Sorocaba
Sao Paulo
100.000 a 105.000
8.000 a 100.000
Itapecerica da
Serra
Densidade Tecnologica
S 1 Ponto = 1
Nûmero de Empregosi
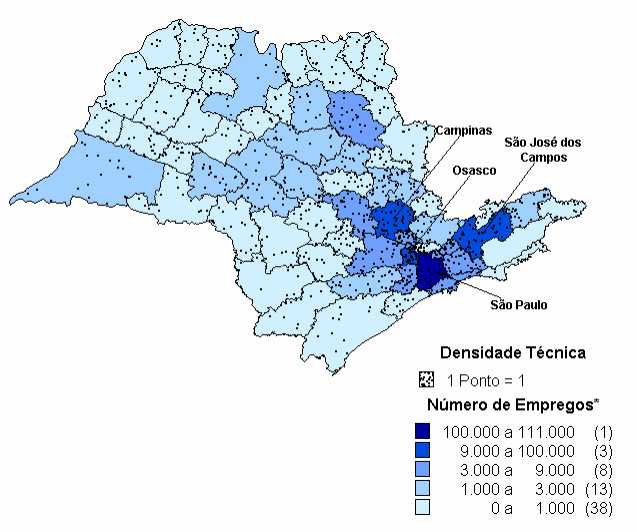
8.000
2.000
1.000
(1)
(2)
(8)
(8)
(44)
2.000 a
1.000 a
0 a
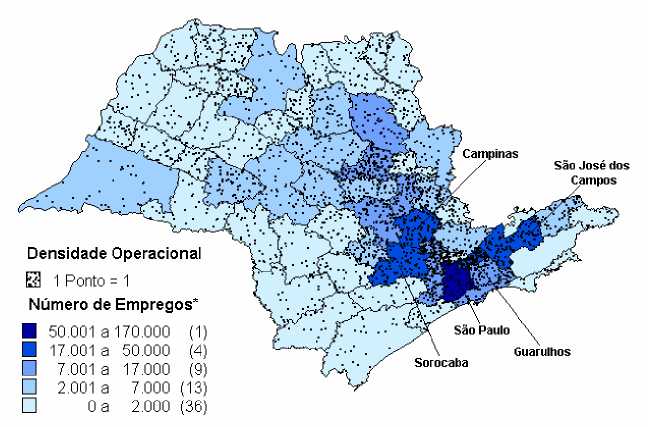
* The intervals refer to values ≥ to the minimum
value and < than the maximum.
** The numbers between parentheses mention
the number of micro-regions in that interval.
Source: RAIS/MTE. Authors own elaboration.
More intriguing information
1. Models of Cognition: Neurological possibility does not indicate neurological plausibility.2. Multifunctionality of Agriculture: An Inquiry Into the Complementarity Between Landscape Preservation and Food Security
3. The name is absent
4. Analyzing the Agricultural Trade Impacts of the Canada-Chile Free Trade Agreement
5. Manufacturing Earnings and Cycles: New Evidence
6. The name is absent
7. Can we design a market for competitive health insurance? CHERE Discussion Paper No 53
8. Mergers and the changing landscape of commercial banking (Part II)
9. An Efficient Circulant MIMO Equalizer for CDMA Downlink: Algorithm and VLSI Architecture
10. The name is absent