12
Figure 2: Companies joining R&D co-operations distinguished according to
their size
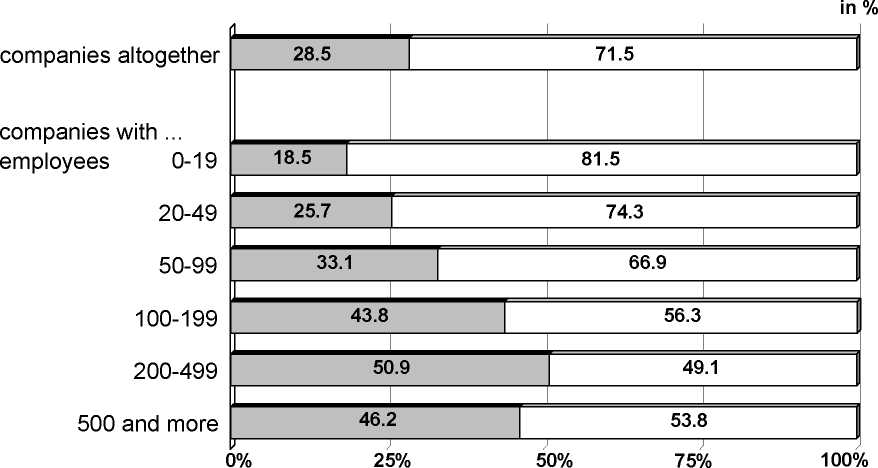
companies: □ participating in R&D co-operations
□ not participating in R&D co-operations
© IfM Bonn
02 32 010
Market performance
Two variables were chosen to be added to the model representing the present
economic performance of the companies on the market: the growth rate of em-
ployees as an indicator for prosperity and the percentage of return on sales as
a mark of the success according to the expenses. The often assumed hy-
pothesis that mainly troubled companies are seeking help by joining co-
operations while those with a good market performance do not require such
subsidy cannot be confirmed. It turns out that both variables do not have a sig-
nificant influence on the willingness to join R&D co-operations. This indicates
that R&D co-operations are set up by growing companies nearly as often as by
companies with stagnating or even diminishing numbers of employees. In addi-
tion to that, companies with temporary negative return on sales do participate
in such partnerships nearly as often as those in a prosperous market environ-
ment. Both indicators show that R&D co-operations are undertaken regardless
of the short-term market performance. This also leads to the conclusion that
R&D co-operations are planned for the long term. A pro cyclical behaviour can
not be assumed.
More intriguing information
1. The name is absent2. The name is absent
3. The name is absent
4. EXECUTIVE SUMMARY
5. The name is absent
6. Sex differences in the structure and stability of children’s playground social networks and their overlap with friendship relations
7. The name is absent
8. Death as a Fateful Moment? The Reflexive Individual and Scottish Funeral Practices
9. Dual Inflation Under the Currency Board: The Challenges of Bulgarian EU Accession
10. Implementation of Rule Based Algorithm for Sandhi-Vicheda Of Compound Hindi Words