27
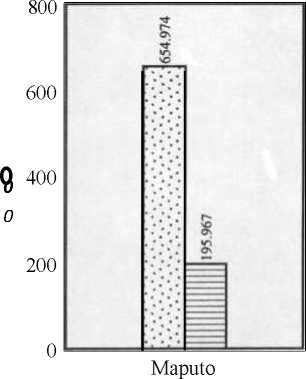
GRAPH 3
Agricultural Land Concessions:
Reported by Provincial* and Central** Government,
1986 - 1993
OCentral Concessions ®Provincial Concessions
250
200
сл
ТЗ
C
«
сл
3
О
150
100
50
71-
N
v)
0
00
-r-,
N/D
N
M
177-1 N/D-
0o0
L.. In/d
Cabo Delgado Gaza Inhambane Nampula Niassa Sofala
* Reported by Provincial Offices of DINAGECA from selected districts.
** Reported in the Boletim da Republica and by DINAGECA, Maputo.
Does not include other Ministry of Agriculture concessions.
Tete Zambezia Manica
N/D = No Data Available
Land Tenure Center,
December 1993
More intriguing information
1. The Integration Order of Vector Autoregressive Processes2. Why unwinding preferences is not the same as liberalisation: the case of sugar
3. DEMAND FOR MEAT AND FISH PRODUCTS IN KOREA
4. Pass-through of external shocks along the pricing chain: A panel estimation approach for the euro area
5. Developments and Development Directions of Electronic Trade Platforms in US and European Agri-Food Markets: Impact on Sector Organization
6. A Brief Introduction to the Guidance Theory of Representation
7. Why Managers Hold Shares of Their Firms: An Empirical Analysis
8. Spatial Aggregation and Weather Risk Management
9. An Interview with Thomas J. Sargent
10. The name is absent