216
Table 7.9: Production growth rates, 1972 to 1986, noncommercial farms sector
|
Copperbelt/ |
Central/ |
Northern/ |
Eastern |
Western | |
|
Beans |
-.009 |
-.066 |
-.042 |
.049 |
-.038 |
|
Cassava |
.015 |
-.208' |
-.013 |
-.109 |
-.042 |
|
Groundnuts |
-.013 |
-.118" |
-.074" |
-.060" |
-.039 |
|
Maize |
.010 |
.013 |
-.065" |
-.063" |
-.052" |
|
Millet |
-.063' |
-.021 |
-.046' |
-.022 |
-.022 |
|
Sorghum |
.011 |
-.043 |
-.027 |
-.001 |
.036 |
* The estimate of B in the regressions is significant at the 10 percent level.
**The estimate of B in the regressions is significant at the 5 percent level.
Source: Derived from Zambia CSO data.
Figure 7.6: Zambia cereals production (thousand metric tons)
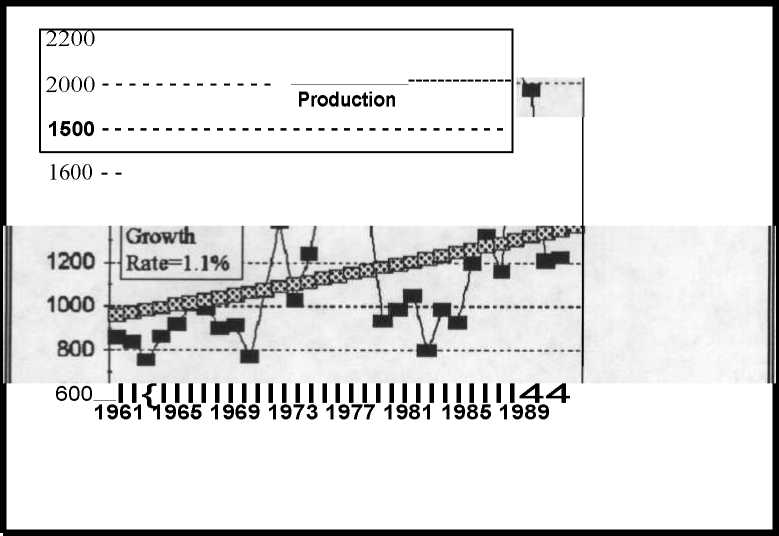
Source: ERS.
More intriguing information
1. The name is absent2. Tastes, castes, and culture: The influence of society on preferences
3. Implementation of Rule Based Algorithm for Sandhi-Vicheda Of Compound Hindi Words
4. On the Integration of Digital Technologies into Mathematics Classrooms
5. The Dictator and the Parties A Study on Policy Co-operation in Mineral Economies
6. Protocol for Past BP: a randomised controlled trial of different blood pressure targets for people with a history of stroke of transient ischaemic attack (TIA) in primary care
7. Large-N and Large-T Properties of Panel Data Estimators and the Hausman Test
8. The name is absent
9. Auctions in an outcome-based payment scheme to reward ecological services in agriculture – Conception, implementation and results
10. Errors in recorded security prices and the turn-of-the year effect