214
► Large farms. Large farms in the northwest region since 1975 appear to have experienced rapid
growth in production of wheat (10.4 percent), soybeans (14.8 percent), and sunflowers (21.7
percent), and declining production in seed maize (-14.3 percent), coffee (-90.1 percent), and
tobacco (-14.9 percent). In the southeast region, production over the long term seems to have
grown most rapidly in wheat (23.2 percent), soybeans (23.9 percent), and burley tobacco
(73.4 percent).
In principle, the sum of growth rates for area and yield should equal that of production. Differences
in the tables arise at times due to missing values and rounding errors.
V. Noncommercial farms sector
Production data from the noncommercial farms sector are available from 1971 to 1985, though
with a gap from 1977 to 1981. Data on area for this sector are available only in the most recent years,
1982 through 1985. Since yield calculations require data on both area and production, yields can only
be calculated for the period 1982 to 1985.
Figure 7.4 depicts changes in the production of maize, groundnuts, millet, and cassava, and
suggests that for the noncommercial sector, the diversification story found in the commercial farms
sector does not apply. Indeed, the story seems to be precisely the opposite. Instead of a gradual
decline in maize production, a dramatic increase is apparent, and other crops generally appear to
decline over time.
Figure 7.4: Noncommercial farm production of maize,
millet, groundnuts, and cassava, 1971 to 1976
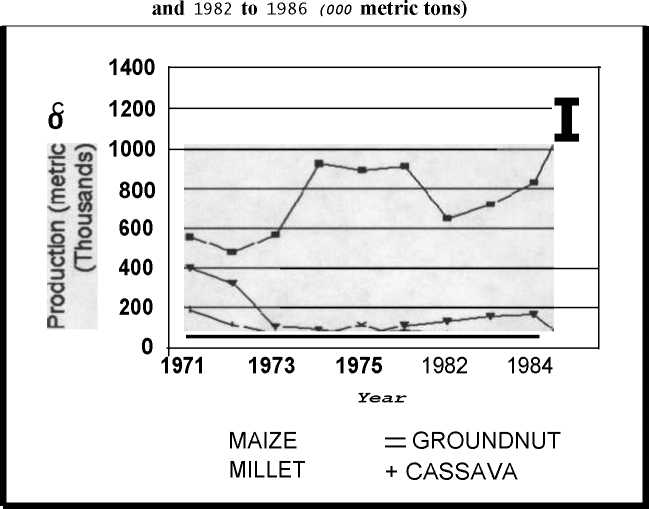
Source: CSO.
More intriguing information
1. Pupils’ attitudes towards art teaching in primary school: an evaluation tool2. The name is absent
3. Integration, Regional Specialization and Growth Differentials in EU Acceding Countries: Evidence from Hungary
4. The Complexity Era in Economics
5. Testing Panel Data Regression Models with Spatial Error Correlation
6. The bank lending channel of monetary policy: identification and estimation using Portuguese micro bank data
7. Perfect Regular Equilibrium
8. The name is absent
9. Olive Tree Farming in Jaen: Situation With the New Cap and Comparison With the Province Income Per Capita.
10. The Macroeconomic Determinants of Volatility in Precious Metals Markets