252
Annex 8.1: Graphs illustrating variation in commercial farm estimates
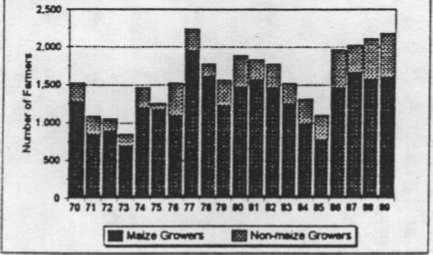
NUMBER OF COMMERCIAL FARMERS
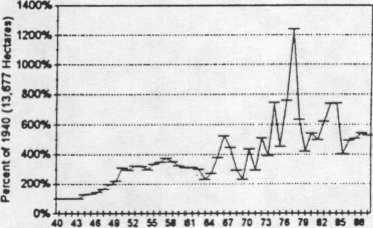
MAIZE AREA
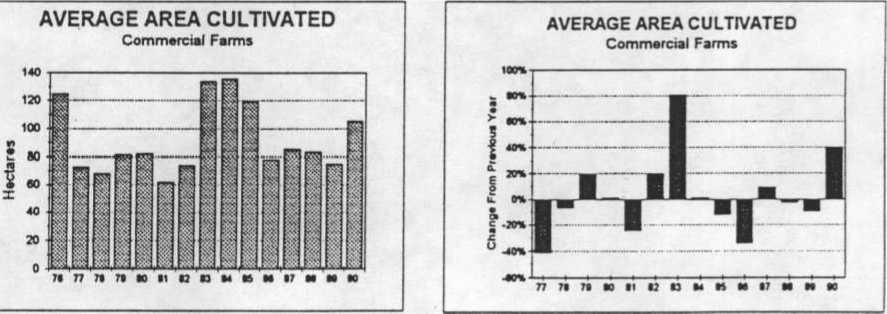
Commercial Farms
200 ----------------------------------
tso

so
-11
II ~1Illfll~∣l

40 43 41 49 02 SS SI It 14 17 70 73 70 79 12 OS OS
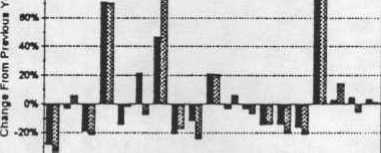
NUMBER OF COMMERCIAL FARMERS
Percent Change from Previous Year
1co%--------------------g------------------------------
MAIZE AREA: Percent of 1940
Commercial Farms
s .«4—----
.0%
71 72 73 74 73 76 77 71 79 90 II 92 83 14 16 1017
IWI Farms El Matra Farms
More intriguing information
1. Alzheimer’s Disease and Herpes Simplex Encephalitis2. FISCAL CONSOLIDATION AND DECENTRALISATION: A TALE OF TWO TIERS
3. The name is absent
4. A Critical Examination of the Beliefs about Learning a Foreign Language at Primary School
5. The name is absent
6. Wage mobility, Job mobility and Spatial mobility in the Portuguese economy
7. The name is absent
8. The name is absent
9. The name is absent
10. Trade and Empire, 1700-1870