In inflation-adjusted terms, the 1993 to 1994 retail price
decrease was slightly more than 10 percent. An elasticity of
-1.3 suggests a 13 percent increase in smoking in response
to that price decline. Changes in consumption behavior take
time. But the price decline of 10 percent in inflation-adjusted
terms persisted through 1997, enough time for behavior
changes to occur. Table 1 and Figure 1 show a negative
trend in consumption with declines averaging nearly 13
billion pieces per year up to 1993. If that negative trend had
continued from 1994 through 1997, a further cumulative
decrease of 52 billion pieces would have been expected. This
52 billion-piece decrease—blocked by the price cuts—would
have been about 11 percent of the 485 billion-piece
consumption of 1993. Eleven percent is in line with the 13
percent response from young people we would expect as the
result of a 10 percent price cut. The long-standing downward
trend in consumption was stopped by the price decreases.
The single price-cutting move in 1993 may have more than
offset all the public and private education and enforcement
efforts to keep young people from starting to smoke during
the 1993 to 1998 period.
Price decreases are very effective in attracting young
people to cigarette consumption.
The important message is that cigarette consumption is
strongly influenced by price, especially for younger people.
When prices go down, consumption is encouraged. When
prices go up, consumption is discouraged. And another
important influence is obviously possible: consumption can
be significantly influenced by sellers’ carefully considered
policies on pricing.
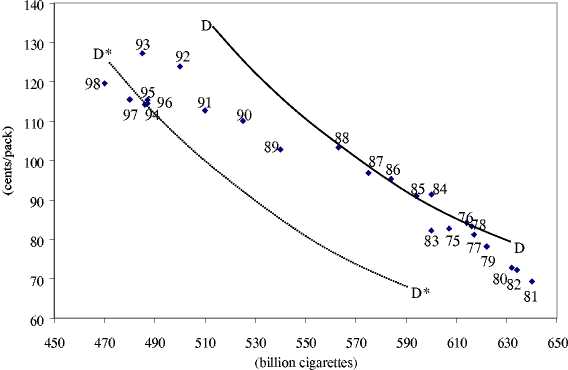
Figure 2 shows a scatter plot of consumption and
inflation-adjusted cigarette prices since 1975 with the years
identified in the diagram. If elasticity of demand has remained
near -.45 for all smokers, the demand curve will have to get
steeper at higher prices and lower quantities (as Figure 2
suggests) to continue to exhibit an elasticity of -.45. A
demand curve, labeled DD, has been sketched through, for
illustrative purposes, the 1985 price/consumption coordinate.
The Rule of “Do Something”
By 1989 and 1990, the data suggest the United States
industry was no longer on DD, but on some lower demand
curve. A demand curve passing through 1989 or 1990 must
be below and to the left of curve DD. And as the 1990s
developed, demand—even though it was being boosted by 1
percent yearly population growth—appears to have continued
to shift lower. A demand curve parallel to DD but through
the 1994 or 1995 coordinates results in D*D*, a much lower
demand curve than DD. Technically, D*D* would need to
be steeper to continue to represent an elasticity of -.45.
However, a parallel shift demonstrates the point: As demand
decreases, the curve representing price/quantity combinations
shifts down. To sellers, this shift has ominous and well-
known implications: Consumers will take the same quantity
of product sold in the prior year only at a lower price. In the
corporate boardroom, a sometimes-panicky effort to “do
something” takes place.
Figure 2. Inflation-Adjusted Price (CPI, 1982-84=100)
and Consumption of Cigarettes, 1975-1998

The graphic clearly shows the flight of consumers as
quantity consumed went down sharply from the early 1980s.
The data in the graph also show that the backing away from
quantity consumed was not due only to the higher prices up
to 1993. Demand was decreasing at the same time. A
growing lack of willingness to pay for and use tobacco was
occurring, a trend that was compounding the market problems
facing the cigarette manufacturers.
The companies followed the rule of “do something.”
The big price cut in 1993 halted the rapid decline in
consumption that started in the early 1980s and was gathering
momentum through early 1993. The price cut held
consumption near 487 billion pieces through 1996 before a
modest decline in 1997 and a somewhat bigger decline in
1998. Consumption was maintained via the price cut, and a
substantial part of maintaining that consumption came in the
form of young people being encouraged to start smoking.
The -1.3 estimate of elasticity for young smokers guarantees
that they would be the group that responded the most to the
price decline.
More intriguing information
1. The name is absent2. Regionale Wachstumseffekte der GRW-Förderung? Eine räumlich-ökonometrische Analyse auf Basis deutscher Arbeitsmarktregionen
3. The mental map of Dutch entrepreneurs. Changes in the subjective rating of locations in the Netherlands, 1983-1993-2003
4. Giant intra-abdominal hydatid cysts with multivisceral locations
5. The geography of collaborative knowledge production: entropy techniques and results for the European Union
6. Testing Gribat´s Law Across Regions. Evidence from Spain.
7. The storage and use of newborn babies’ blood spot cards: a public consultation
8. Trade Liberalization, Firm Performance and Labour Market Outcomes in the Developing World: What Can We Learn from Micro-LevelData?
9. The name is absent
10. An Investigation of transience upon mothers of primary-aged children and their school