days
T TOTAL
□ FOOD
д WINE
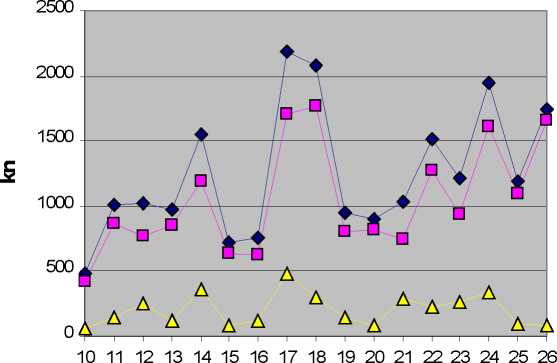
Graph 1. The amounts of daily turnover in the Srdela snack test object
Graph 1 shows daily fluctuations in the sales of food, drinks and in the total
turnover of the restaurant in the test period.
Consumer survey and interviews
Consumers gave their assessment s for the following characteristics: quality of
the meal offered, general idea of the project, quality of service and logo
design. The ratings were given on a five- point Likert- type scale.
More intriguing information
1. Stakeholder Activism, Managerial Entrenchment, and the Congruence of Interests between Shareholders and Stakeholders2. The Challenge of Urban Regeneration in Deprived European Neighbourhoods - a Partnership Approach
3. The name is absent
4. Land Police in Mozambique: Future Perspectives
5. Conditions for learning: partnerships for engaging secondary pupils with contemporary art.
6. The Interest Rate-Exchange Rate Link in the Mexican Float
7. The name is absent
8. The Global Dimension to Fiscal Sustainability
9. Influence of Mucilage Viscosity On The Globule Structure And Stability Of Certain Starch Emulsions
10. A Theoretical Growth Model for Ireland