1.00
0.75
0.50
0.25
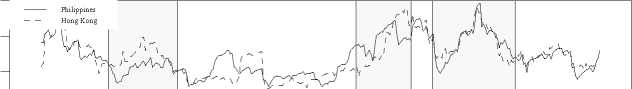
volatility
75
50
25
I I I I I I I 11 I I I I I I I I 11 I I I I I I I I I I I I I I I I I I I I I Il I I I I I I I I I I I I I I I I I I I Il I I I I I I I I I I
0
1994 1995 1996 1997 1998 1999
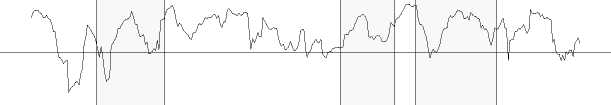
1.0
0.5
0.0
-0.5
-1.0
correlation
Iiiiiiiiiiiiiiiii Iiiiiiiiiiiiiiiiiiiiiiiiiiiiii Iiiiiiiiiiiiiiiiiiiiiiii
1994 1995 1996 1997 1998 1999
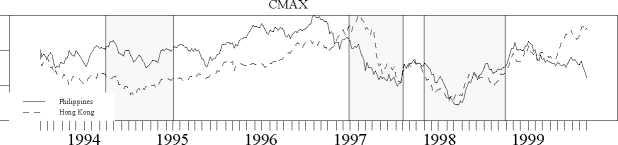
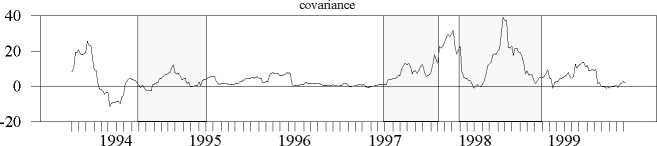
Figure 4: CMAX, instantaneous volatility, covariance and correlation between
stock market returns of Hong Kong and the Philippines. Shaded areas corre-
spond to the periods of crisis defined in the text.
More intriguing information
1. The Provisions on Geographical Indications in the TRIPS Agreement2. Input-Output Analysis, Linear Programming and Modified Multipliers
3. GOVERNANÇA E MECANISMOS DE CONTROLE SOCIAL EM REDES ORGANIZACIONAIS
4. The name is absent
5. The name is absent
6. NATURAL RESOURCE SUPPLY CONSTRAINTS AND REGIONAL ECONOMIC ANALYSIS: A COMPUTABLE GENERAL EQUILIBRIUM APPROACH
7. The name is absent
8. The name is absent
9. CURRENT CHALLENGES FOR AGRICULTURAL POLICY
10. Education Responses to Climate Change and Quality: Two Parts of the Same Agenda?