.5 -
.5
Fraction Fraction

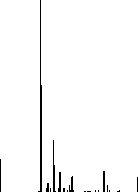
Histogram
Log of Minimum Wage, 1988
4
8
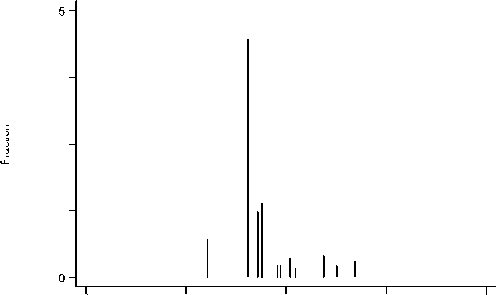
Histogram
Log of Minimum Wage, 1999
Histogram
Log of Minimum Wage, 1993
^8
Figure 1: The Distribution of Legal Minimum Wages in Costa Rica,
1988, 1993 and 1999
20
More intriguing information
1. The growing importance of risk in financial regulation2. A Classical Probabilistic Computer Model of Consciousness
3. Types of Tax Concessions for Promoting Investment in Free Economic and Trade Areas
4. Social Irresponsibility in Management
5. The Macroeconomic Determinants of Volatility in Precious Metals Markets
6. The name is absent
7. The Context of Sense and Sensibility
8. Elicited bid functions in (a)symmetric first-price auctions
9. The name is absent
10. The name is absent