Figure 1: Marginal WTP Estimates

East

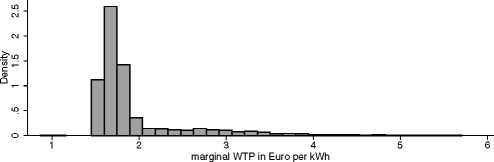
marginal WTP in Euro per kWh
Figure 1 shows the distribution of households’ MWTP per kWh change in
the building’s primary energy demand. An interesting insight into the valuation
of energy savings in Germany can be gleaned from the lower panel of Figure 1,
which shows the distributions of MWTP estimates according to whether house-
holds live in the eastern or western part of the country. Eastern households are
seen to reveal a much higher MWTP and a larger variability in their estimates,
determining almost the entire right tail of the distribution in the upper panel.
Table 3 reports summary statistics of MWTP estimates obtained from the error
components logit model. Eastern households exhibit a mean MWTPofe3.28 per
kWh, while the mean western MWTP is considerably less at e1.72.9 The much
lower standard deviation indicates that the evaluation of energy savings among
western households is fairly homogenous. Given that the immense discrepancy in
9Using a Mann-Whitney test we checked whether the east and the west MWTP stems from
the same population. We reject this hypotheses at a significance level of p < 0.0001.
18
More intriguing information
1. Feature type effects in semantic memory: An event related potentials study2. Environmental Regulation, Market Power and Price Discrimination in the Agricultural Chemical Industry
3. School Effectiveness in Developing Countries - A Summary of the Research Evidence
4. Placenta ingestion by rats enhances y- and n-opioid antinociception, but suppresses A-opioid antinociception
5. The name is absent
6. Expectation Formation and Endogenous Fluctuations in Aggregate Demand
7. Manufacturing Earnings and Cycles: New Evidence
8. Naïve Bayes vs. Decision Trees vs. Neural Networks in the Classification of Training Web Pages
9. The name is absent
10. The Evolution