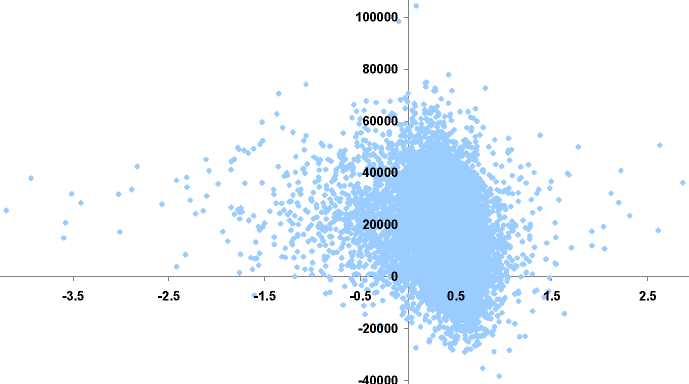
band of QALY scores mostly ranging from 0 to 0.9 QALYS compared to the CT negative
range of around 0.5 to 3 QALYs, whilst there is similar variability in the costs to the CT
negative results. This results in the clear implication that higher threshold ratio will be needed
for the PET strategy to be implemented by a decision maker than compared to the CT negative
results. There are also a larger number of negative QALYs in the CT positive with a
significantly dense spread to the left of the graph suggesting much more uncertainty in the CT
positive results.
Graph 2: The distribution of costs and Benefits and the resulting QALYs for CT positive
patients
120000
-4.5
3.5
■60000
QALYS
• ICER
The mean, median and inter quartile range were taken from the simulation of 10,000
runs. In the CT negative patients the mean ICER for the PSA is very close to the mean in the
baseline result with only a difference of about $A 37 per QALY and therefore shows that the
baseline model is robust in the results with little variability in the parameters. The median is
also close to the mean and shows that the distribution does not appear to be heavily skewed.
Table16: The mean, median and inter quartile range for Ct negative patients in the
simulation
|
CT |
Incremental Costs |
Incremental QALYS |
ICER | |
|
Mean |
26197.16 ~ |
1.80 ~ |
14543.1 | |
|
Median |
25628.17 |
1.76 |
13596.0 | |
|
Inter- |
25 |
10692.55 |
1.23 |
5047.8 |
|
75 |
43202.51 |
2.38 |
25236.8 |
26
More intriguing information
1. The name is absent2. Sectoral specialisation in the EU a macroeconomic perspective
3. A Duality Approach to Testing the Economic Behaviour of Dairy-Marketing Co-operatives: The Case of Ireland
4. Optimal Tax Policy when Firms are Internationally Mobile
5. An Efficient Secure Multimodal Biometric Fusion Using Palmprint and Face Image
6. Testing the Information Matrix Equality with Robust Estimators
7. The name is absent
8. WP 1 - The first part-time economy in the world. Does it work?
9. The name is absent
10. The name is absent