Figure 1
Rural Household Income
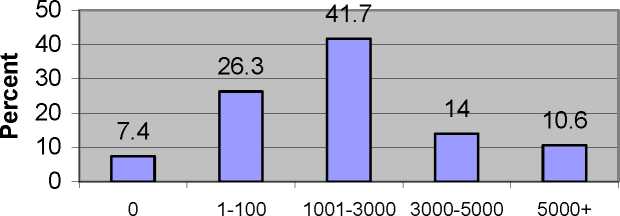
Yearly income (yuan)
Figure 2
Urban Household Income
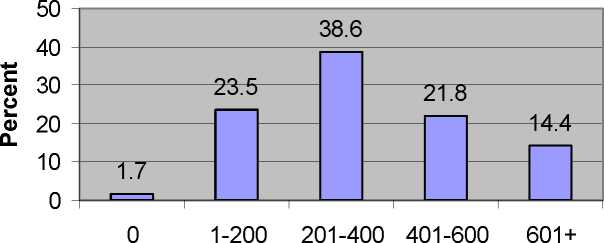
Mothly income (yuan)
Gini coefficients were computed for a more accurate picture of income inequality
in the rural and urban areas and the respective values found to be significantly different -
0.5046 and 0.34869. The Gini coefficient can be expressed as a ratio of two regions defined
by a 45-degree line (line of perfect equality) and a Lorenz curve. The Lorenz curves for
both sectors are shown in Figure 3. Let A denote the area between the 45-degree line and
the Lorenz curve and A+B be the whole area below the 45-degree line or ½ of the unit box.
9 Urban inequality would certainly be higher if the “floating population” (migrant workers) would have been
included.
More intriguing information
1. An Economic Analysis of Fresh Fruit and Vegetable Consumption: Implications for Overweight and Obesity among Higher- and Lower-Income Consumers2. Learning-by-Exporting? Firm-Level Evidence for UK Manufacturing and Services Sectors
3. Modeling industrial location decisions in U.S. counties
4. Neural Network Modelling of Constrained Spatial Interaction Flows
5. Structure and objectives of Austria's foreign direct investment in the four adjacent Central and Eastern European countries Hungary, the Czech Republic, Slovenia and Slovakia
6. Real Exchange Rate Misalignment: Prelude to Crisis?
7. Land Police in Mozambique: Future Perspectives
8. The open method of co-ordination: Some remarks regarding old-age security within an enlarged European Union
9. AN ECONOMIC EVALUATION OF COTTON AND PEANUT RESEARCH IN SOUTHEASTERN UNITED STATES
10. NVESTIGATING LEXICAL ACQUISITION PATTERNS: CONTEXT AND COGNITION