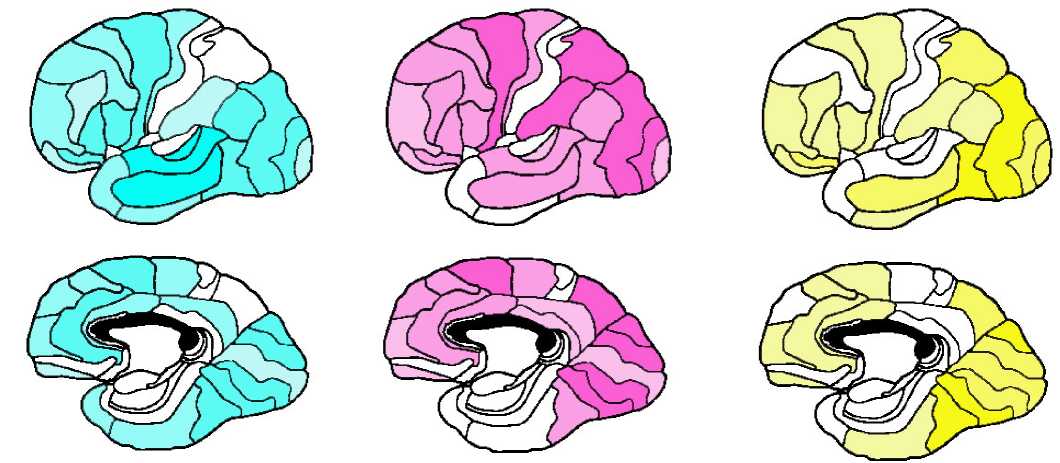
Figure 2: Color-coded activations of left cortex. The figure illustrates the activations of Brodmann areas
in the left hemisphere according to color and intensity, where color represents the cognitive domain and
intensity the number of tasks in the domain activating the area. In this figure, cyan represents language,
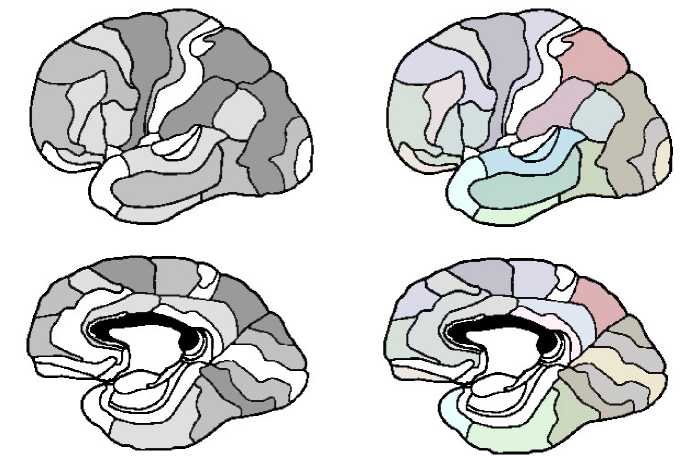
magenta represents attention, yellow represents perception and black represents imagery. Overlaying the
single-color images gives the 4-color image in the bottom center. This image contrasts sharply with the
standard picture of localization by domain as shown in the bottom right panel.
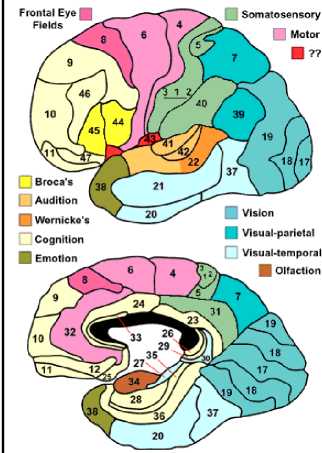
Far from supporting the standard notion that cognitive functions are generally localizable
by domain (as illustrated in the lower right panel of figure 2), the data suggest a much
10
More intriguing information
1. Structural Influences on Participation Rates: A Canada-U.S. Comparison2. Correlation Analysis of Financial Contagion: What One Should Know Before Running a Test
3. The name is absent
4. The name is absent
5. Response speeds of direct and securitized real estate to shocks in the fundamentals
6. The name is absent
7. The name is absent
8. Fiscal Policy Rules in Practice
9. On the Existence of the Moments of the Asymptotic Trace Statistic
10. Structure and objectives of Austria's foreign direct investment in the four adjacent Central and Eastern European countries Hungary, the Czech Republic, Slovenia and Slovakia