
AMGD = 1
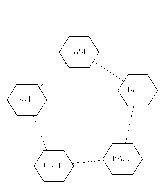
AMGD = 1.5

AMGD = 2.0
Figure 1: Illustrations of the average minimum graph distance (AMGD). The figure shows the
average minimum graph distances between nodes in some simple graphs. Lines between nodes indicate
adjacency.
Results
On average, each of the 135 tasks activated 5.97 regions (SD 4.80). Perceptual tasks
activated 4.88 (n = 42, SD 3.55), attention 5.26 (n = 39, SD 4.23), imagery 6.39 (n = 18,
SD 3.29) and language 7.81 (n = 36, SD 6.56). More importantly, the 86 brain regions
that were activated by at least one task supported, on average, 9.36 different tasks (SD
8.62). Ignoring the division into medial and lateral regions gives an average of 13.00
tasks per area (SD 8.44), nearly one in ten of the tasks surveyed.
The activations were not limited to closely related tasks. Of the 86 regions activated in
some task, 57 (66.3%) had activations in at least three categories; 28 of these had
activations in all four categories. Only 15 regions (17.4%) had activations in just one
category. Counting the number of tasks by category that activated each region, and
normalizing the count of tasks in each category to n=42, shows that an average of 37.8%
More intriguing information
1. LAND-USE EVALUATION OF KOCAELI UNIVERSITY MAIN CAMPUS AREA2. Synchronisation and Differentiation: Two Stages of Coordinative Structure
3. Fiscal Reform and Monetary Union in West Africa
4. MATHEMATICS AS AN EXACT AND PRECISE LANGUAGE OF NATURE
5. The name is absent
6. Regional specialisation in a transition country - Hungary
7. ISO 9000 -- A MARKETING TOOL FOR U.S. AGRIBUSINESS
8. EDUCATIONAL ACTIVITIES IN TENNESSEE ON WATER USE AND CONTROL - AGRICULTURAL PHASES
9. The name is absent
10. The name is absent