CHAPTER 5. SIMULATION RESULTS
44
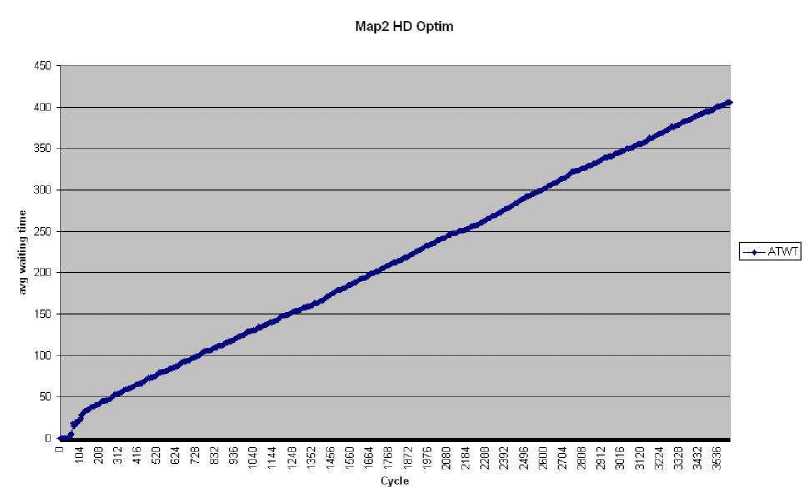
Figure 5.15: Map2 - high density - optim ATWT
5.2.2 Optim controller
High traffic density The optim controller has an ATWT of 406 and the TWQL
is 2467. (See figure 5.15 for the waiting times)
Low traffic density The optim controller has an ATWT of 332 and a TWQL
of 1040. With this controller, edge-node 11 has the biggest waiting queue (372).
This also shows that the traffic from edge-node 0 to 11 has an advantage to the
traffic from edge-node 11 to 0. The spawn-frequency of edge-node 0 is 0.15 and
for edge-node 11 it is 0.1.
More intriguing information
1. Transport system as an element of sustainable economic growth in the tourist region2. Optimal Rent Extraction in Pre-Industrial England and France – Default Risk and Monitoring Costs
3. QUEST II. A Multi-Country Business Cycle and Growth Model
4. The name is absent
5. A COMPARATIVE STUDY OF ALTERNATIVE ECONOMETRIC PACKAGES: AN APPLICATION TO ITALIAN DEPOSIT INTEREST RATES
6. Commuting in multinodal urban systems: An empirical comparison of three alternative models
7. The name is absent
8. Constructing the Phylomemetic Tree Case of Study: Indonesian Tradition-Inspired Buildings
9. The name is absent
10. Permanent and Transitory Policy Shocks in an Empirical Macro Model with Asymmetric Information