Questionnaire Two Characterisation of the Sample
The following graphs and tables demonstrate some of the most prominent variables from
the ordinal regression analysis. The responses to the questionnaire are collapsed into
three responses (yes = agree and strongly agree. Unsure = neither agree nor disagree. No
= disagree and strongly disagree). The items are presented in relation to the variable
which is significant to it. For illustrative purposes, qualitative data from phase one is
included after each item.
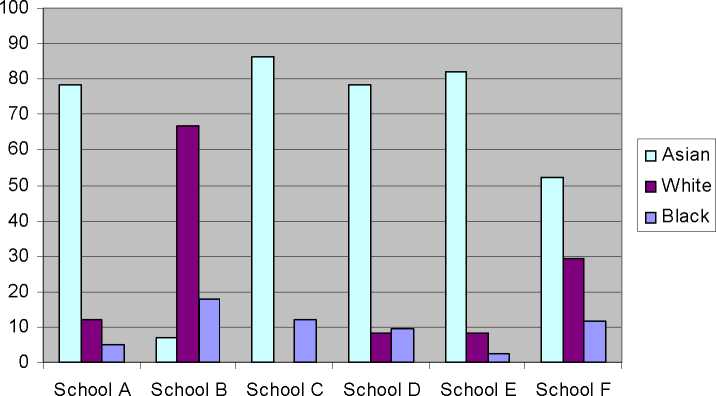
1. Ethnicity in Schools Sampled by Ethnicity and Schools
|
Ethnicity |
Asian |
Ethnicity White |
Black | ||||
|
N |
% |
N |
% |
N |
______% | ||
|
School A |
139 |
78.5 |
21 |
11.9 |
9 |
5.1 | |
|
School B |
9 |
6.9 |
87 |
66.9 |
23 |
17.7 | |
|
School C |
101 |
86.3 |
0 |
0 |
14 |
12 | |
|
School D |
185 |
78.4 |
19 |
8.1 |
23 |
9.7 | |
|
School E |
100 |
82 |
10 |
8.2 |
3 |
2.5 | |
|
School F |
108 |
52.2 |
61 |
29.5 |
24___ |
11.6 | |
|
Total |
643 |
63.4 |
198 |
19.5 |
96___ |
9.5 | |
Asians made up just under two thirds of the research sample with white students
accounting for just under 20% and black students at 9%. 25 students did not give their
62
More intriguing information
1. A Multimodal Framework for Computer Mediated Learning: The Reshaping of Curriculum Knowledge and Learning2. The name is absent
3. Determinants of U.S. Textile and Apparel Import Trade
4. Private tutoring at transition points in the English education system: its nature, extent and purpose
5. NVESTIGATING LEXICAL ACQUISITION PATTERNS: CONTEXT AND COGNITION
6. The name is absent
7. Une Classe de Concepts
8. The name is absent
9. Dynamic Explanations of Industry Structure and Performance
10. Two-Part Tax Controls for Forest Density and Rotation Time