3.
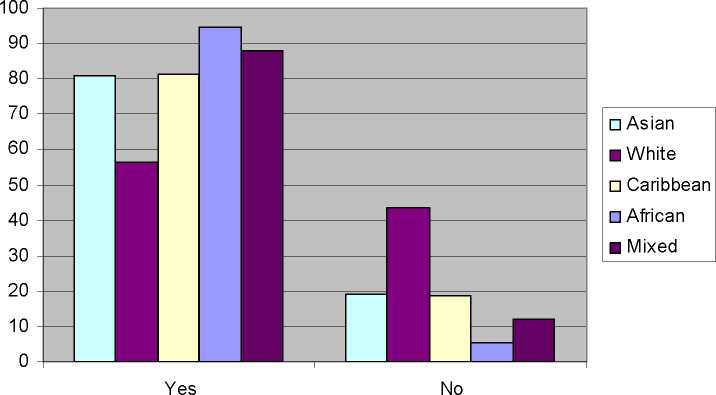
Students’ Ambition to Attend University by Ethnicity
|
University |
Asian |
White |
Caribbean |
African |
Mixed | |||||
|
N |
%_ |
N |
%__ |
N |
%__ |
N |
%__ |
N |
% | |
|
Yes |
447 |
80.8 |
106 |
56.4 |
26 |
81.3 |
55 |
94.8 |
43 |
87.8 |
|
No |
106 |
19.2 |
82 |
43.6 |
6 |
18.8 |
3 |
5.2 |
6 |
12.2 |
|
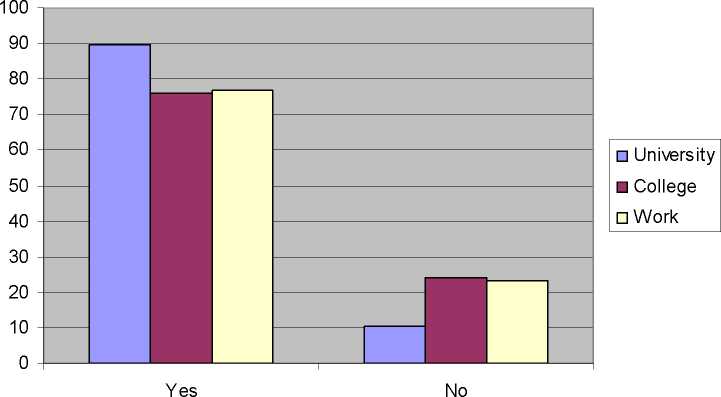
Parents’ Education |
University |
College |
Work |
Total | ||||
|
N |
% |
N |
% |
N |
% |
N |
% | |
|
Yes |
122 |
89.7 |
208 |
75.9 |
354 |
76.8 |
684 |
78.5 |
|
No |
14___ |
10.3 |
66__ |
24.1 |
107 |
23.2 |
187 |
21.5 |
66
More intriguing information
1. Globalization, Redistribution, and the Composition of Public Education Expenditures2. The name is absent
3. The name is absent
4. The name is absent
5. The name is absent
6. Integration, Regional Specialization and Growth Differentials in EU Acceding Countries: Evidence from Hungary
7. Firm Creation, Firm Evolution and Clusters in Chile’s Dynamic Wine Sector: Evidence from the Colchagua and Casablanca Regions
8. Unemployment in an Interdependent World
9. The name is absent
10. Willingness-to-Pay for Energy Conservation and Free-Ridership on Subsidization – Evidence from Germany