125
is taken into the bore of the scanner, and the TMS console itself generates a small
amount of noise. The left column of Figure 11 shows what normal images of the
phantom should look like while the right column show images collected with the TMS
system present and active. While the majority of the area within the scanner is
undistorted, the superior-most region does show a significant amount of noise (bottom
right image). Ifthis area happened to correspond with a region of interest, the quality
ofdata would be greatly diminished.
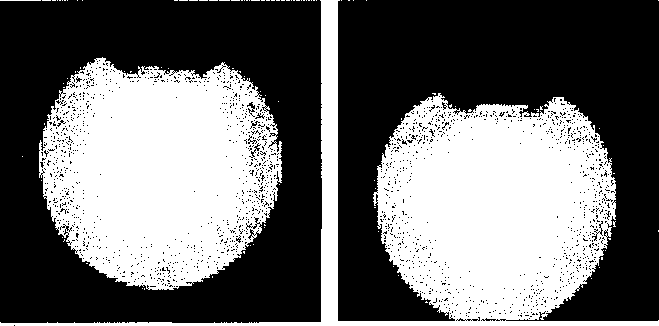
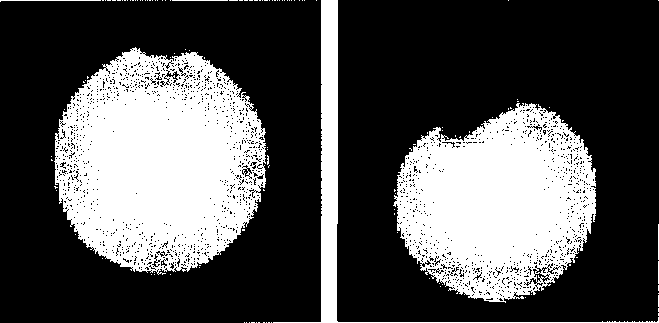
Figure 11 Remaining noise. The images on the left show axial slices of the phantom without the TMS
system present, and the one images on the right show slices with the TMS system present and active.
The top images are through the midline whereas the bottom images are more superior. Notice the
distortion in the bottom right image.
More intriguing information
1. Achieving the MDGs – A Note2. The name is absent
3. A Consistent Nonparametric Test for Causality in Quantile
4. Testing Panel Data Regression Models with Spatial Error Correlation
5. Benchmarking Regional Innovation: A Comparison of Bavaria, Northern Ireland and the Republic of Ireland
6. Prizes and Patents: Using Market Signals to Provide Incentives for Innovations
7. The name is absent
8. The Effects of Attendance on Academic Performance: Panel Data Evidence for Introductory Microeconomics
9. The name is absent
10. The Role of Trait Emotional Intelligence (El) in the Workplace.