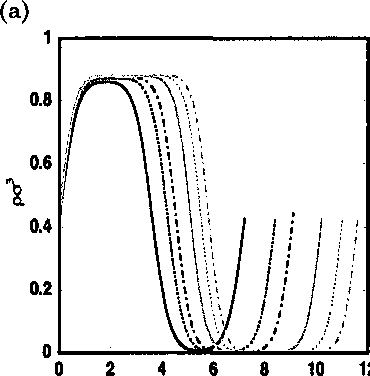
(CMS) density functional theory [144]. Figure 5.4a shows the equilibrium density
profiles of these diblock copolymers. For smaller N, the profiles are approximately
sinusoidal and for larger N, they become almost step-like.
(b)
4 6 8 10 12 14 16
z∕σ L∕σ
Figure 5.4: (a) Equilibrium segment density profiles of the A block of the copolymer for N
= 5 (solid black curve, Db = 7.2σ), 6 (dashed black curve, Z⅛ = 8.4σ), 7 (dot-dashed black
curve, D⅛ = 9.1σ), 8 (solid gray curve, B⅛ = 10.2σ), 9 (dashed gray curve, Db = 11.0σ), and
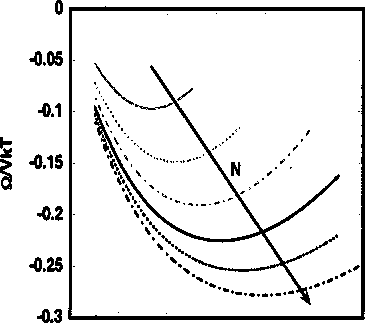
10 (dot-dashed gray curve, Db = 11.6σ), and (b) grand free energy of the copolymer per
unit volume as a function of the width of the computational domain for N = 5 (solid gray
curve), 6 (dashed gray curve), 7 (dot-dashed gray curve), 8 (solid black curve), 9 (dashed
black curve), and 10(dot-dashed black curve). e∕kT = 0.289 for all the cases.
5.3.2 Confined diblock copolymer ultra-thin films
The lamellar structure of the (symmetric AB diblock) copolymer is significantly
affected when they are confined between two planar surfaces separated by H, where
H is of the order of the bulk equilibrium lamellar period of the copolymer. The
128
More intriguing information
1. The name is absent2. DISCUSSION: ASSESSING STRUCTURAL CHANGE IN THE DEMAND FOR FOOD COMMODITIES
3. Implementation of a 3GPP LTE Turbo Decoder Accelerator on GPU
4. Placentophagia in Nonpregnant Nulliparous Mice: A Genetic Investigation1
5. Land Police in Mozambique: Future Perspectives
6. Demographic Features, Beliefs And Socio-Psychological Impact Of Acne Vulgaris Among Its Sufferers In Two Towns In Nigeria
7. Prizes and Patents: Using Market Signals to Provide Incentives for Innovations
8. A Consistent Nonparametric Test for Causality in Quantile
9. EXECUTIVE SUMMARY
10. Dementia Care Mapping and Patient-Centred Care in Australian residential homes: An economic evaluation of the CARE Study, CHERE Working Paper 2008/4