47
Frequency response to ZAP current input at distal end of leaf
68
0 100 200 300 400 500
Distance from soma (μm)
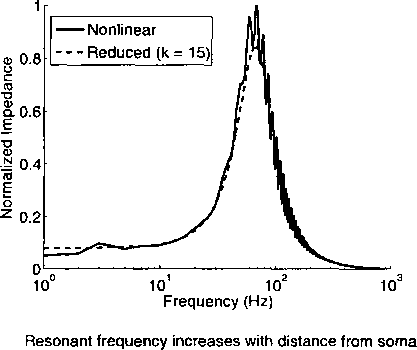
Figure 2.11: A) Frequency-response curves for ZAP current injection at different dendritic lo-
cations on the forked neuron with uniform channels. We applied ZAP current for 1000 ms with
time-step ∆t = 0.1 ms and computed the normalized impedance versus frequency. Both curves
show the same trend, with a peak near 65 Hz, but the reduced system took only 2 seconds, whereas
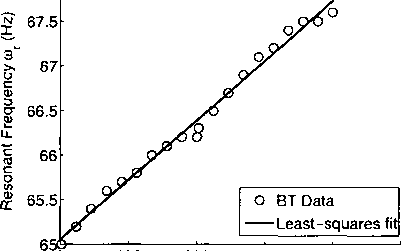
the nonlinear system took 39 seconds. B) Scatter plot of resonant frequencies versus distance from
the soma (o), with the least-squares linear fit to the data (thick line). For this experiment, we
sampled frequencies every 0.1 Hz on the interval [55,75] using the current in (2.43) and found that
the resonant frequency increases nearly linearly as the stimulus location moves away from the soma.
IRKA (Figure 2.12B), and we compare this to the error curve shown in Figure 2.8A.
Notice that nearly 5-digit agreement occurs for a 25-dimensional system using IRKA.
This is close to what we would expect from the BT method (20-dimensional system),
but IRKA required only 5 seconds to compute the reduced system (Figure 2.12A),
whereas BT required 4.6 hours. Thus similar accuracy with IRKA can be obtained
More intriguing information
1. Multimedia as a Cognitive Tool2. The Values and Character Dispositions of 14-16 Year Olds in the Hodge Hill Constituency
3. Clinical Teaching and OSCE in Pediatrics
4. Language discrimination by human newborns and by cotton-top tamarin monkeys
5. The name is absent
6. FISCAL CONSOLIDATION AND DECENTRALISATION: A TALE OF TWO TIERS
7. The name is absent
8. Putting Globalization and Concentration in the Agri-food Sector into Context
9. Factores de alteração da composição da Despesa Pública: o caso norte-americano
10. Short report "About a rare cause of primary hyperparathyroidism"